

Austin’s Active Listings Soar 635.6% from 2022 to 2025: A Data Deep Dive
Published | Posted by Dan Price
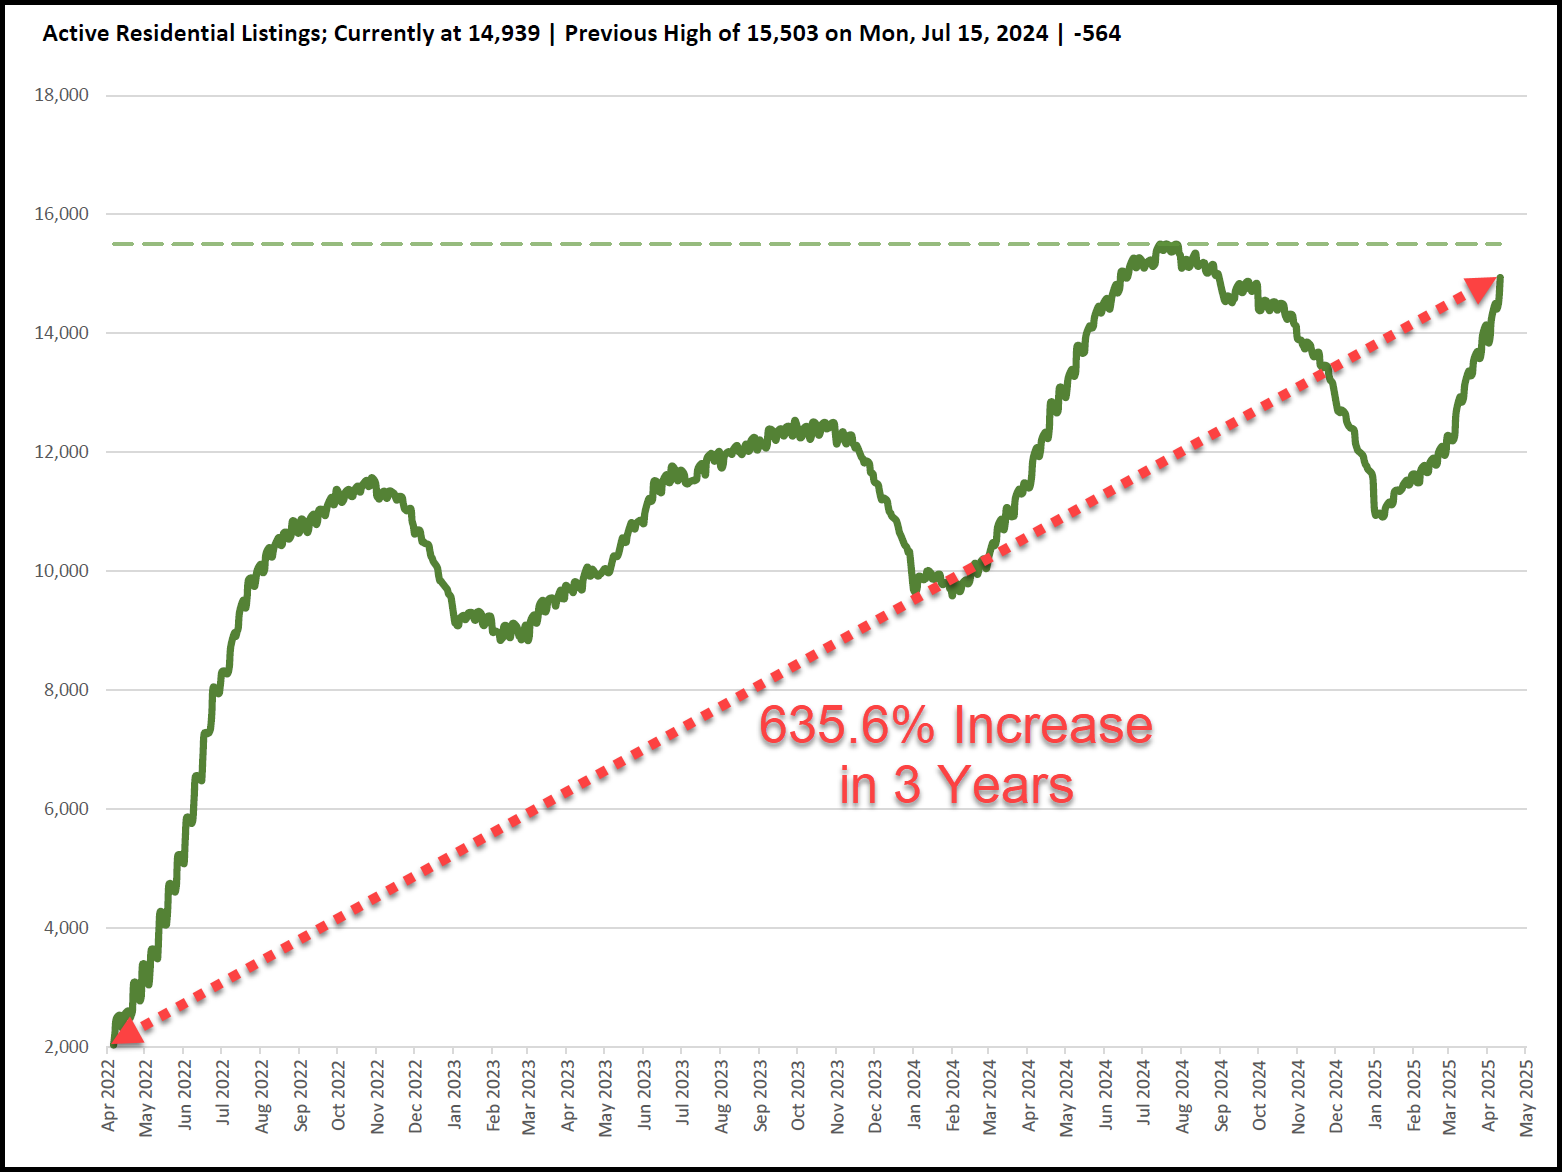
Tracking the Growth of Austin’s Active Residential Listings from 2022 to 2025 : The Austin real estate market has experienced remarkable changes in its inventory of homes for sale over the past three years. Data tracking active residential listings from April 6, 2022, to April 11, 2025, shows a dramatic increase, starting at 2,031 listings and rising to 14,939. This growth, recorded daily on weekdays, offers a clear picture of how the number of available homes in the Austin area has evolved. The dataset, which includes 731 days of records, also highlights a peak of 15,503 listings on July 15, 2024, just 564 more than the April 2025 figure. These numbers, provided by Team Price Real Estate and last revised on April 11, 2025, reveal a dynamic housing market worth exploring.
The journey began in April 2022, when the Austin area had only 2,031 active listings on April 6. By the end of that month, on April 29, the number had climbed to 3,389, a jump of 1,358 listings. This upward trend continued through 2022, with significant growth in June, when listings rose from 5,107 on May 31 to 8,128 by June 30, an increase of 3,021 homes. The year ended with 9,555 listings on December 30, 2022, showing a steady rise from the spring low. Daily changes during this period were often substantial, such as a 469-listing increase from April 21 to April 22, 2022, when numbers went from 2,611 to 3,080. These figures demonstrate how quickly the market expanded in its early phase.
In 2023, the growth in active listings slowed but remained consistent. Starting the year at 9,134 on January 2, the count reached 11,376 by September 30, with a high of 12,538 on September 29. Monthly changes were more moderate than in 2022, with June 2023 adding 1,392 listings (from 10,307 on May 31 to 11,699 on June 30) and July adding another 202 (to 11,901 on July 28). Daily fluctuations were less extreme, though notable shifts occurred, like a 287-listing rise from June 8 to June 9, 2023, moving from 11,222 to 11,509. By December 29, 2023, listings stood at 10,329, reflecting a stable but growing inventory compared to the previous year’s 9,555.
The year 2024 marked a significant milestone, as active listings reached their all-time high of 15,503 on July 15. The year began with 9,906 listings on January 5 and grew steadily through the spring, hitting 13,044 by April 30, a 258-listing increase from March 29’s 12,786. June and July saw strong growth, with listings rising from 14,505 on May 31 to 15,272 by June 28, a 767-listing gain, and then to the peak in mid-July. Daily changes included a 256-listing jump from June 13 to June 14, 2024, when numbers went from 14,779 to 15,035. However, late 2024 saw declines, with listings falling to 11,541 by December 31, a drop of 1,615 from November 29’s 13,156, including a significant 479-listing decrease from December 31 to January 1, 2025.
Entering 2025, the market showed a mix of recovery and growth. January started at 10,971 listings on January 3, down from December 2024, but by March 28, the count had risen to 13,968, a gain of 2,997 listings. April 2025 continued this upward trend, reaching 14,939 by April 11, an increase of 798 listings from March 31’s 14,141. The first two weeks of April were particularly active, with a 292-listing rise from April 3 to April 4 (13,946 to 14,238) and a 260-listing increase from April 7 to April 8 (14,238 to 14,498). These daily and weekly shifts, such as a 701-listing jump from April 4 to April 11, highlight a strong spring market, though still below the July 2024 peak of 15,503.
Comparing April 2025 to previous years shows the scale of change. In April 2024, listings ended at 13,044, meaning April 2025’s 14,939 represents a 1,895-listing increase, or 14.53%. Back in April 2022, the month closed at 3,389 listings, so the 2025 figure is over four times higher, a 340.8% growth from that point. Monthly averages also tell a story: April 2022 averaged about 2,700 listings daily, April 2023 around 9,800, April 2024 about 12,445, and April 2025 (through April 11) averages 14,292. These numbers show a market that has consistently expanded its inventory over time, with seasonal peaks in summer and occasional dips in winter.
The data also reveals patterns in how listings change week to week. For example, the week ending April 11, 2025, saw a 701-listing increase from the prior week’s 14,238, one of the largest weekly gains in the dataset. In contrast, the week ending April 12, 2024, added 258 listings, and April 29, 2022, saw a 309-listing rise. Over the three years, weekly gains were strongest in spring and summer, with June 2022 posting a 694-listing increase (from 6,551 to 7,275) and May 2022 adding 478 (from 4,738 to 5,216). Late-year declines, like the 444-listing drop from November 29 to December 6, 2024, are common, reflecting seasonal slowdowns.
In summary, the Austin area’s active residential listings have grown from 2,031 on April 6, 2022, to 14,939 on April 11, 2025, a 635.6% increase. The market hit a high of 15,503 in July 2024, with April 2025’s figure just 3.64% below that peak. Daily changes, like the 292-listing spike on April 4, 2025, and weekly gains, such as 701 listings in early April, show a robust spring market. Year-over-year comparisons highlight steady growth, with 2023 averaging 10,750 listings, 2024 at 12,691, and 2025 (through April) at 12,172. This detailed dataset offers a clear view of how Austin’s housing inventory has expanded, providing valuable insights into its real estate trends.
FAQ Section
What are active residential listings in real estate?
Active residential listings are homes listed for sale that are currently available on the market. These properties have not yet been sold or removed from listings. In Austin, active listings grew from 2,031 on April 6, 2022, to 14,939 by April 11, 2025, showing a significant increase in available homes over three years.
How do you calculate the percentage change in active listings?
To calculate the percentage change in active listings, subtract the earlier number from the later number to find the difference. Divide that difference by the earlier number and multiply by 100. For example, Austin’s listings increased from 2,031 in April 2022 to 14,939 in April 2025, a difference of 12,908. Dividing by 2,031 and multiplying by 100 gives a 635.6% increase.
Why do active listings change over time?
Active listings change due to factors like market demand, new home construction, and seasonal trends. Austin’s data shows growth from 2,031 listings in April 2022 to 15,503 in July 2024, with declines in winter months like December 2024 (11,541 listings) and rebounds in spring, such as April 2025 (14,939 listings), reflecting typical market cycles.
Related Articles
Keep reading other bits of knowledge from our team.
Request Info
Have a question about this article or want to learn more?
