Austin's Three Hottest Zip Codes Right Now: 78728, 78739, and 78748
March 12, 2026 | Team Price Real Estate | teamprice.com
Across 75 zip codes and dozens of Austin-area submarkets, three zip codes are standing out from everything else right now: 78728 in North Austin, 78739 in South Austin, and 78748 in South Austin. These are not opinions — they are the product of a real-time analysis of the Activity Index and Months of Inventory across the entire Austin real estate market, updated as of March 12, 2026. When you screen every zip code in the metro simultaneously for high buyer demand and low available supply, these three rise to the top of the list with data that is impossible to ignore.
The Activity Index measures the percentage of properties under contract relative to total active and pending listings combined. The higher the number, the more aggressively buyers are absorbing available inventory. Months of Inventory measures how long it would take to sell all current listings at the current pace of sales. Below six months signals a seller's market. Below three months signals a highly competitive, fast-moving market. Below two months means buyers are competing hard for almost nothing. All three of these zip codes are operating at or near that threshold right now.
78728 | North Austin — Wells Branch
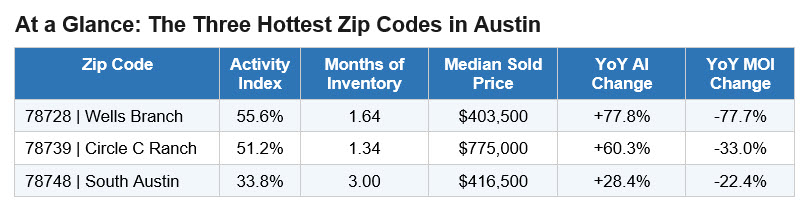
Zip code 78728 sits at the very top of the Austin market right now with an Activity Index of 55.6% — the highest reading of any zip code across the entire 75-zip dataset. To understand what that means in practical terms: more than half of all properties that come to market in this area go under contract before they can accumulate any significant inventory. With only 12 active listings against 15 pending contracts and 1.64 months of supply, the math is straightforward. There is almost nothing available here, and what does come available is being absorbed at an extraordinary rate.
What makes 78728 particularly striking is the trajectory. One year ago, this zip code had 7.33 months of inventory — still elevated from the post-pandemic correction. As of today, that figure has collapsed by 77.7% year-over-year to just 1.64 months. Simultaneously, the Activity Index has surged 77.8% over the same period, from 31.3% in March 2025 to 55.6% in March 2026. That is a dual compression — inventory cratering while buyer demand accelerates — that produces exactly the kind of environment where prices move upward quickly.
The Wells Branch neighborhood within 78728 tells an even sharper story. With only 3 active listings and 6 pending contracts, the neighborhood-level Activity Index hits 66.7% with just 0.82 months of inventory. That is effectively no inventory. Homes are selling faster than the market can replenish supply. The median sold price in the broader zip sits at $403,500, which positions 78728 as one of the most accessible competitive markets in the Austin metro — a rare combination of affordability and intensity that tends to attract strong buyer pools.
Looking at the price range breakdown, the data confirms heat across the board. The $300K–$400K band carries a 50% Activity Index with just 1.1 months of inventory. The $400K–$500K band is at 54% with 2.0 months. The $500K–$600K range reaches 67% activity. And the $600K–$700K tier has a 100% Activity Index, meaning there are zero active listings in that price band and everything is under contract. This is a zip code operating in full seller's market mode across every price point it serves.
78739 | South Austin — Circle C Ranch
Zip code 78739 holds the second-highest Activity Index in the Austin market at 51.2% and, more importantly, the lowest Months of Inventory of any zip code in the entire dataset at just 1.34 months. With 21 active listings and 22 pending contracts, the number of homes under contract has essentially matched the number of homes still available. This is an extraordinarily tight supply-demand balance, and it is getting tighter. The Activity Index in 78739 has risen 60.3% year-over-year, while months of inventory have dropped 33.0% from a year ago and sit 64.7% below the 12-month peak recorded earlier in 2025.
The Circle C Ranch neighborhood within 78739 exemplifies what is driving this zip code. Circle C carries a 57.1% Activity Index and only 1.23 months of inventory, with 9 active listings and 12 pending contracts. The median sold price at the neighborhood level is $750,000, and the broader zip code median sold price is $775,000. This is the Austin real estate market's higher-price-point hot zone — a market where homes in the $700,000 to $900,000 range are moving at a pace that rivals anything you would see in an entry-level neighborhood.
The price range data for 78739 is where the story becomes most compelling. The $700K–$800K band carries a 75% Activity Index — the single highest reading of any price band in this zip — with only 0.8 months of inventory. The $600K–$700K band is at 60% activity with 1.5 months. The $500K–$600K band is at 46% with 2.1 months. Even the $400K–$500K entry point carries a 40% Activity Index. This is a zip code where buyer competition is fierce at every price level, with the luxury-adjacent $700K–$800K segment being the most contested tier in the market.
It is worth noting that 78739 has no new construction inventory tracked in this dataset. Every transaction happening here is resale, which means supply cannot be replenished by builders. When a neighborhood like Circle C Ranch runs low on inventory, there is no pipeline of new homes coming to fill the gap. That structural supply constraint is a key reason why this zip code's Activity Index has accelerated so sharply over the past year, and why months of inventory has compressed to levels that rival the most competitive periods in Austin's recent market history.
78748 | South Austin — A Market With Range
Zip code 78748 occupies a different position in this analysis than the other two. It does not top the Activity Index rankings — it sits at 33.8%, which places it 10th out of 75 zip codes. But it earns its place on this list for a different reason: it is a large, liquid market with high transaction volume, improving momentum, and a price range structure that reveals surprising pockets of extreme heat that most buyers and agents are not paying attention to.
With 106 active listings, 54 pending contracts, and 106 homes sold in the past 90 days, 78748 is one of the highest-volume zip codes in the dataset. Its Activity Index has risen 28.4% year-over-year while months of inventory have dropped 22.4%. The resale market within 78748 is running a 34.5% Activity Index with 2.85 months of inventory — a genuine seller's market with real absorption happening at scale. The median sold price of $416,500 makes this zip accessible to a broad buyer pool, and that accessibility is generating consistent demand that is steadily compressing supply.
The most surprising data point in 78748, however, is what is happening in the $700K–$800K price band. Despite the zip code's reputation as a mid-range South Austin market, the $700K–$800K tier is running a 56% Activity Index with just 1.5 months of inventory. That is the single hottest price band in the zip and a reading that would be exceptional in any market in the metro. It suggests a growing cohort of move-up buyers competing aggressively for larger, higher-end homes within the 78748 footprint — a dynamic that is quietly reshaping the character of this submarket.
The broader price range data shows consistent activity from the $300K entry point all the way through the luxury tier. The $300K–$400K band carries a 47% Activity Index. The $400K–$500K range is at 32%. The $500K–$600K and $600K–$700K bands each hold 31% activity. The high-end $900K–$1000K tier sits at 33%. This is a market with no dead zones by price range — a rare characteristic that signals broad, structural buyer demand rather than narrow demand concentrated in a single price tier.
What This Data Means for Buyers and Sellers
For sellers in 78728, 78739, or 78748, the current data represents an opportunity. With Activity Indexes ranging from 33.8% to 55.6% and months of inventory well below the equilibrium threshold of six months, pricing power sits firmly with sellers. Homes priced correctly are going under contract quickly, and the year-over-year momentum in all three zip codes suggests conditions have tightened meaningfully over the past 12 months — not loosened.
For buyers targeting any of these three zip codes, the data is a clear signal to enter with preparation and speed. In 78728 and 78739 especially, with sub-2.0 months of inventory and Activity Indexes above 50%, waiting or testing the market with low offers is a strategy that is unlikely to succeed. Properties at the right price point in these areas are being absorbed before most buyers have time to schedule a second showing. Working with an agent who tracks real-time Activity Index and Months of Inventory data by zip code — and by price range within each zip code — is not optional in this kind of market. It is the difference between getting into contract and watching homes sell from the sidelines.
The broader Austin real estate market is running an overall Activity Index of 31.4% across all 75 zip codes combined, with 4.60 months of inventory. These three zip codes are operating at conditions significantly more competitive than the market average — in some cases nearly double the metro-wide demand intensity. That divergence between the average and the outliers is one of the defining characteristics of the current Austin housing market: a bifurcated landscape where certain zip codes are running hot while others remain soft, and where real-time data analysis is the only reliable way to know which is which.
Frequently Asked Questions
What does the Activity Index mean in Austin real estate?
The Activity Index is a real-time demand metric calculated as pending sales divided by the total of active plus pending listings. It measures what percentage of the available market is under contract at any given moment. An Activity Index above 30% signals strong demand, above 40% indicates a highly competitive seller's market, and readings above 50% — like those currently seen in 78728 and 78739 — reflect an exceptionally tight market where supply is being absorbed faster than it can be replaced. Team Price Real Estate tracks this metric across all 75 zip codes in the Austin metro, updated continuously from MLS data, to give buyers and sellers a real-time read on market conditions.
Which Austin zip codes are the hottest right now in 2026?
Based on current MLS data as of March 2026, the three hottest zip codes in the Austin real estate market are 78728 in North Austin near Wells Branch (Activity Index 55.6%, 1.64 months of inventory), 78739 in South Austin covering the Circle C Ranch area (Activity Index 51.2%, 1.34 months of inventory — the lowest in the metro), and 78748 in South Austin (Activity Index 33.8%, 3.00 months of inventory). All three are outperforming the metro-wide average Activity Index of 31.4% and are operating in seller's market territory. The year-over-year momentum in each zip is also strongly positive, indicating these conditions have been building over the past 12 months rather than appearing suddenly.
Is the Austin housing market a buyer's or seller's market in 2026?
The answer depends heavily on which zip code and price range you are asking about. At the metro level, the Austin real estate market is running a 31.4% Activity Index with 4.60 months of inventory, which places it in equilibrium to mild seller's market territory. However, individual zip codes tell very different stories. In areas like 78728, 78739, and 78748, conditions are firmly in seller's market territory with months of inventory well below 3.0. In contrast, areas like 78701 (downtown Austin) and Lago Vista are running double-digit months of inventory and Activity Indexes below 16%, firmly in buyer's market territory. The Austin housing market in 2026 is highly fragmented, and the aggregate market statistics mask wide variation between submarkets.
What is considered a good months of inventory in Austin?
In the Austin real estate market, months of inventory below 6.0 is generally considered a seller's market where demand exceeds supply. Between 3.0 and 6.0 months reflects a moderately competitive market with some seller advantage. Below 3.0 months signals a highly competitive seller's market where buyers face multiple offers and limited negotiating power. Below 2.0 months — the current condition in 78728 at 1.64 and 78739 at 1.34 — represents near-peak competition where homes routinely sell quickly after listing and price reductions are rare. The metro-wide Austin average is currently 4.60 months of inventory, which means the three hot zip codes covered in this article are operating at a fraction of the overall market's supply level.
Why are some Austin zip codes so much more competitive than others?
The divergence in Austin housing market conditions across zip codes is driven by a combination of supply constraints, price point accessibility, school district quality, neighborhood maturity, and the absence of new construction pipelines. Areas like 78739 (Circle C Ranch) have no new construction to replenish inventory, meaning every home that sells is one fewer available to the next buyer. Areas like 78728 combine relative affordability with strong absorption, creating competition across all price bands simultaneously. Meanwhile, luxury zip codes and outer suburban areas with heavy new construction supply face very different dynamics. Tracking the Activity Index and Months of Inventory by zip code and by price range within each zip is the most reliable way to understand these differences, which is exactly what Team Price Real Estate publishes and monitors across all 75 Austin-area zip codes.