• Sign Up
  • Log In
Jo Leung
Jo Leung
    • Market Report
    • Newsletter
    • Areas
      • Hutto
      • Fort Hood
      • Buda
      • Bastrop
      • Barton Hills
      • Round Rock
      • Cedar Park
      • Austin
      • Westlake Hills
      • Tarrytown
      • Crestview
      • Downtown Austin
    • Search
      • Search Properties
      • Featured Properties
    • Statistics
    • Articles
      • My Articles
      • Team Price Articles
    • Market Update
    • About
      • Meet Jo Leung
      • About Team Price
      • Testimonials
    • Contact
    • Jo Leung
    • Team Price Real Estate
      7320 N Mo-Pac
      Austin, TX 78731
      (512) 213-0213
      dan@teamprice.com

    Search

    • Search Properties
    • By City
    • By Subdivision
    • By Zip

    Explore

    • Featured Properties
    • Areas
    • Property Search

    Company

    • Guarantee
    • Work with Us
    • Interview Questions
    • Join Our Team

    Resources

    • Insight and Statistics
    • Tenant Pre-Screening
    • Real Estate Forms
    • Real Estate Glossary

    About

    • Home
    • About
    • Agents
    • Testimonials
    • Contact Us
    Jo Leung - Footer Logo
    • Texas Real Estate Commission Information About Brokerage Services
    • Texas Real Estate Commission Consumer Protection Notice
    • Privacy
    • Terms
    • DMCA
    • Accessibility
    • Fair Housing
    © 2026 Team Price Real Estate. All rights reserved.
    Website built by CloseHack.
    Central Texas Multiple Listing Service

    Central Texas MLS | Four Rivers Association of REALTORS® All information deemed reliable but not guaranteed. All properties are subject to prior sale, change or withdrawal. Neither listing broker(s) or information provider(s) shall be responsible for any typographical errors, misinformation, misprints and shall be held totally harmless. Listing(s) information is provided for consumer's personal, non-commercial use and may not be used for any purpose other than to identify prospective properties consumers may be interested in purchasing. The data relating to real estate for sale on this website comes in part from the Internet Data Exchange program of the Multiple Listing Service. Real estate listings held by brokerage firms other than Jo Leung may be marked with the Internet Data Exchange logo and detailed information about those properties will include the name of the listing broker(s) when required by the MLS. Copyright ©2022 All rights reserved.

    Austin Board of Realtors

    The information being provided is for consumers' personal, non-commercial use and may not be used for any purpose other than to identify prospective properties consumers may be interested in purchasing. Based on information from the Austin Board of REALTORS®. Neither the Board nor ACTRIS guarantees or is in any way responsible for its accuracy. All data is provided "AS IS" and with all faults. Data maintained by the Board or ACTRIS may not reflect all real estate activity in the market.

    • MLSGrid IDX Data Notice
    • DMCA Notice
    Austin Housing Affordability Explained by ZIP Code and Income

    Austin Housing Affordability Explained by ZIP Code and Income

    Published 12/23/2025 | Posted by Dan Price

    Housing affordability in Austin is often discussed in headlines, but rarely explained correctly. Prices alone do not determine whether a market is affordable. What matters is how much of a household’s income is required to carry a monthly mortgage payment, including principal, interest, taxes, and insurance. When that ratio becomes too high, demand slows regardless of how strong the local economy appears.

    Using Team Price Real Estate’s daily affordability data, Austin housing affordability can be measured consistently by comparing monthly mortgage payments to median household income. This approach removes emotion from the discussion and replaces it with math. It also reveals why affordability deteriorated so quickly after 2021 and why improvement since then has been uneven.

    Austin’s affordability breakdown peaked in mid 2022 when monthly mortgage payments consumed roughly forty seven percent of median household income. That level was historically extreme and well above long term norms. Since that peak, affordability has improved as home prices declined and payments moderated. As of late 2025, the share of income required for a typical mortgage payment has fallen closer to thirty five percent. That is a meaningful improvement, but still elevated compared to the pre pandemic average, which hovered closer to the high twenties.

    One of the most important takeaways from the data is that affordability did not improve because incomes surged. It improved because prices corrected. This distinction matters. Income growth tends to be slow and incremental, while prices can adjust more quickly. Austin’s market is still working through that adjustment.

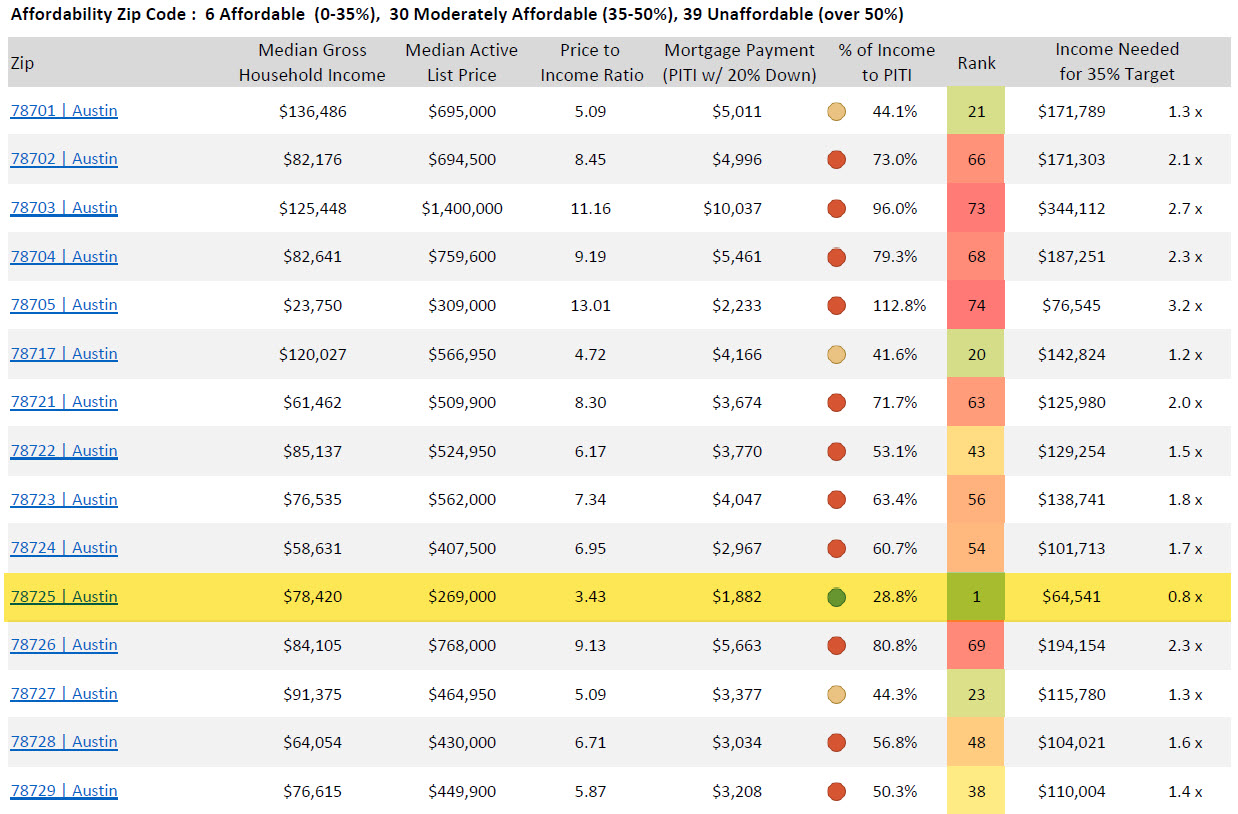
    Affordability in Austin is also highly uneven across ZIP codes. When affordability is measured at the ZIP code level, the city no longer looks like a single market. Out of seventy five Austin ZIP codes, only six currently fall below the thirty five percent affordability threshold. Thirty are moderately affordable, and thirty nine remain unaffordable, requiring more than half of median household income just to cover a mortgage payment.

    ZIP code 78725 stands out as the most affordable area in the Austin market. With a median active list price around two hundred sixty nine thousand dollars and a typical mortgage payment consuming less than thirty percent of median household income, it remains one of the few places where affordability still functions without excessive financial strain. This does not mean prices are rising rapidly there. It means the market is aligned with local incomes in a way most other ZIP codes are not.

    This ZIP level concentration explains why some buyers feel locked out of Austin while others are still able to transact. It also explains why broad statements about the Austin housing market often miss the mark. Affordability today is not a citywide condition. It is location specific and payment driven.

    For buyers, this means focusing less on headline prices and more on monthly payment math. For sellers, it reinforces the importance of pricing within the range where buyers can realistically qualify. For investors, it highlights why long term demand stability is strongest in areas where affordability remains intact.

    Austin housing affordability is improving, but it remains fragile. The market is no longer driven by excess demand. It is constrained by income and payment realities. Understanding those mechanics at the ZIP code level is no longer optional.

    This affordability analysis is updated daily using Team Price Real Estate data and reflects real time changes in prices, mortgage rates, and household income conditions across the Austin market.

    • Austin housing affordability
    • austin real estate affordability
    • Austin housing costs
    • austin mortgage payments
    • austin home prices and income
    • affordable austin zip codes
    • austin price to income ratio
    • Austin housing market analysis

    Related Articles

    Keep reading other bits of knowledge from our team.

      Request Info

      Have a question about this article or want to learn more?