

Austin Housing Affordability: Median Sold Price to Income Ratio Trends 2000-2025
Published | Posted by Dan Price
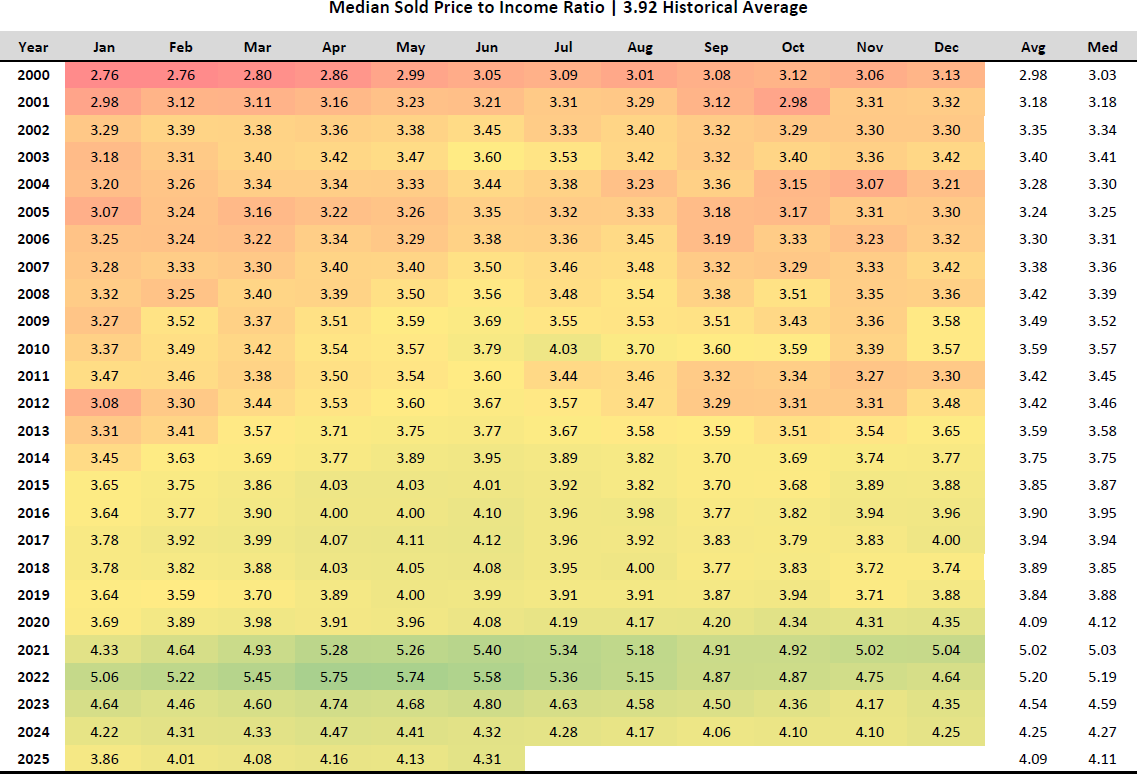
Austin’s Housing Affordability Trends Through the Median Sold Price to Income Ratio
If you’ve been keeping an eye on the Austin housing market, you might have noticed some interesting changes in how affordable homes have become over the years. One key way to measure this is through the median sold price to income ratio, which compares the median home price to the average household income in the area. For Austin, this ratio has been tracked since 2000, with a historical average of 3.92 based on data up to June 2025. This means that, on average, the median home price has been about 3.92 times the area’s household income. Let’s look into the numbers to see how this ratio has shifted and what it tells us about affordability today.
Looking at the most recent data from June 2025, the median sold price to income ratio stands at 4.31. This figure comes from a detailed table compiled by the Affordability Team at Price Real Estate, last revised on June 17, 2025. To put this in perspective, the highest ratio recorded was 5.75 in April 2022, showing a time when homes were much less affordable compared to incomes. Since that peak, the ratio has dropped by 1.44 points, which translates to a 25.04% improvement in affordability. This decline suggests that homes in Austin are becoming more within reach for residents, though the journey back to historical norms is still ongoing.
To understand where Austin stands today, it’s helpful to compare the current ratio of 4.31 to the long-term average of 3.92 over the 25 years from 2000 to 2025. The difference is 0.39, meaning the ratio would need to decrease by about 9.05% to match the 3.92 average. Another benchmark is the pre-pandemic period from 2015 to 2019, when the annual averages ranged from 3.80 to 3.94, with an overall average of 3.90. Compared to this, the June 2025 ratio of 4.31 is 0.41 points higher, requiring a 9.51% drop to return to that level. These gaps highlight that while affordability has improved, it hasn’t yet returned to the levels seen before the pandemic.
Breaking the data into different time periods reveals more about these trends. From 2015 to 2019, before the pandemic, the ratio stayed relatively stable, starting at 3.65 in January 2015 and peaking at 4.03 in May 2015, with an average of 3.90 across those years. Then, starting in 2020, the ratio began to climb, reaching 3.69 in January and soaring to 5.75 by April 2022—a 65% increase over that span. This sharp rise reflected a challenging time for affordability. However, from April 2022 to June 2025, the ratio fell to 4.31, marking a significant recovery. This 25% improvement shows a clear trend toward better affordability in recent years.
One factor that could influence future affordability is changes in household income. The median sold price to income ratio depends on both home prices and income levels. If incomes in Austin rise, the ratio could stay the same only if home prices adjust downward. For instance, to reach the 25-year average of 3.92 from the current 4.31, prices would need to drop by about 9.05% to offset a potential income increase. Similarly, to match the pre-pandemic average of 3.90, a 9.51% price decrease would be needed. These calculations assume incomes grow while other factors remain constant, offering a glimpse into what might be required to restore historical affordability levels.
As Austin continues to evolve, tracking this ratio will be key to understanding housing market trends. The data from 2000 to 2025, with the latest update in June 2025, provides a solid foundation for analyzing how affordability has shifted. Whether you’re a potential homebuyer, a real estate professional, or just curious about the market, these numbers offer a clear picture of where Austin stands and where it might be headed.
FAQ Section
1. What is the median sold price to income ratio?
The median sold price to income ratio is a metric that compares the median home sale price to the average household income in a specific area, such as Austin. For example, a ratio of 4.31, as seen in June 2025, means the median home price is 4.31 times the average household income. This ratio, tracked from 2000 to 2025 with a historical average of 3.92, helps assess housing affordability. A lower ratio indicates homes are more affordable relative to income, while a higher ratio suggests the opposite. The data, sourced from the Affordability Team at Price Real Estate, shows how this ratio has fluctuated, peaking at 5.75 in April 2022 and declining to 4.31 by June 2025.
2. How has housing affordability changed in Austin?
Housing affordability in Austin has improved significantly since its peak. The median sold price to income ratio reached 5.75 in April 2022 but dropped to 4.31 by June 2025, a decrease of 1.44 points or a 25.04% improvement. This trend is based on data spanning 2000 to 2025, with the historical average at 3.92. Compared to the pre-pandemic average of 3.90 (2015-2019), the current ratio of 4.31 is 0.41 points higher, indicating affordability has not yet returned to pre-2020 levels. The decline since 2022 suggests a recovery, though further reductions of 9-9.5% are needed to match historical averages.
3. What was the highest median sold price to income ratio in Austin?
The highest median sold price to income ratio in Austin was 5.75, recorded in April 2022. This figure comes from a comprehensive dataset covering 2000 to June 2025, compiled by the Affordability Team at Price Real Estate. At this peak, the median home price was 5.75 times the average household income, marking the least affordable period in the 25-year span. Since then, the ratio has decreased to 4.31 by June 2025, reflecting a 25.04% improvement in affordability, though it remains above the historical average of 3.92.
4. How does income affect the median sold price to income ratio?
Income plays a critical role in the median sold price to income ratio, as it directly influences affordability when paired with home prices. The current ratio of 4.31 in June 2025, compared to the 25-year average of 3.92, shows a 0.39-point gap. If household incomes rise, home prices must decrease by approximately 9.05% to maintain the 3.92 ratio, assuming no other changes. To reach the pre-pandemic average of 3.90, a 9.51% price drop would be needed. This dynamic, based on data from 2000 to 2025, highlights the balance between income growth and price adjustments in Austin’s housing market.
5. What is the historical average median sold price to income ratio in Austin?
The historical average median sold price to income ratio in Austin is 3.92, calculated from data spanning 2000 to June 2025. This average, derived from monthly and annual figures compiled by the Affordability Team at Price Real Estate, reflects the long-term relationship between median home prices and household incomes. The ratio has varied widely, from 2.76 in January 2000 to a peak of 5.75 in April 2022, before settling at 4.31 in June 2025. This 3.92 average serves as a benchmark, with the current ratio of 4.31 indicating a 9.05% deviation that would need to close for full affordability recovery.
Related Articles
Keep reading other bits of knowledge from our team.
Request Info
Have a question about this article or want to learn more?
