
Austin Housing Forecast: New Listing to Pending Ratio Matches Post-February High
Published | Posted by Dan Price
Austin Real Estate Market: Absorption Quietly Firms As New-To-Pending Ratio Hits Post-February High
Austin’s absorption is quietly tightening: August’s New Listing to Pending Ratio rose to 0.75, matching February 2025’s high and signaling steadier buyer engagement even as inventory remains elevated.
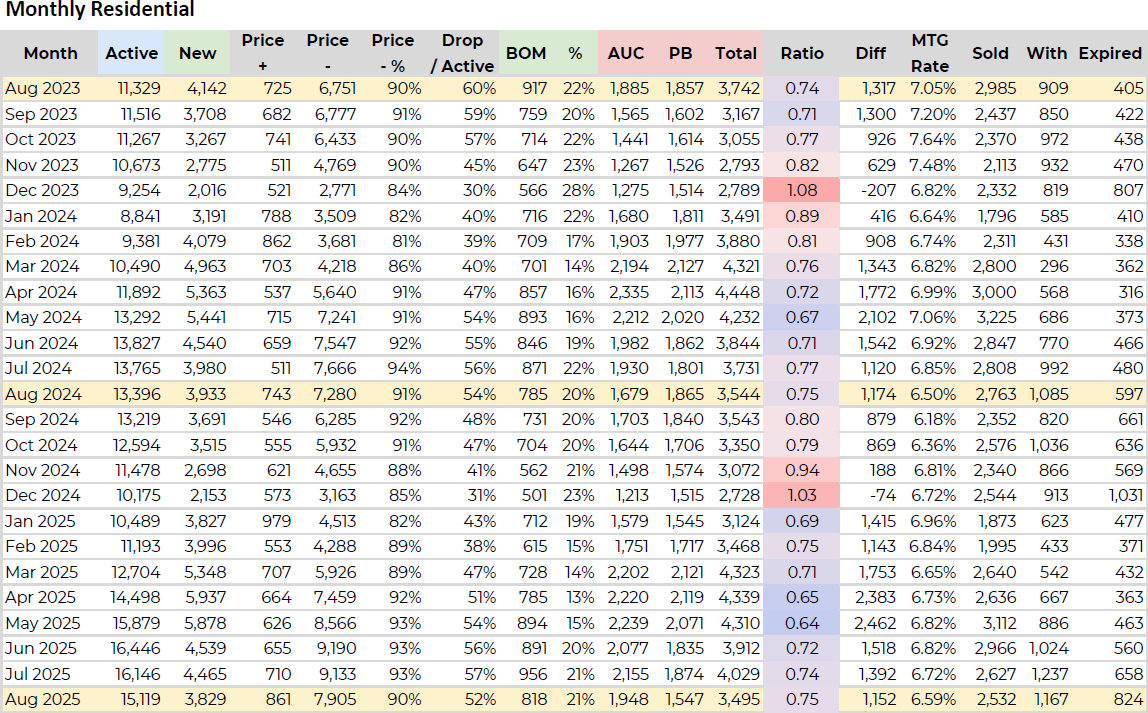
The New Listing to Pending Ratio is a leading indicator because it compares fresh supply to contracts being written. In August, the market logged 3,829 new listings and 818 back-on-market returns, for 4,647 incoming opportunities. Buyers and agents moved 1,948 active-under-contract and 1,547 pending deals, for 3,495 total in-contract properties. Divide supply inflow by contracts (4,647 ÷ 3,495) and you get 0.75—a level that historically improves before prices do. Framed simply: the Austin real estate market is absorbing new and returning listings at the strongest pace since February 2025, which is why this metric matters for any Austin housing forecast.
Month over month, absorption ticked up from 0.74 in July to 0.75 in August, a modest but directionally positive shift. Year over year, August is flat at 0.75 vs. 0.75 last August, showing that while demand hasn’t surged, it’s holding its own against a larger inventory backdrop. That steadiness is important because it suggests the Austin property market is finding balance after a choppy first half.
Inventory context adds depth to the signal. Active listings climbed to 15,119 in August, up about 13% from 13,396 a year ago. Despite that higher base, new listings actually ran slightly lighter year over year (3,829 vs. 3,933), and the number of properties moving into contract (AUC + Pending) was only marginally lower (3,495 vs. 3,544). Put together, that’s how the ratio stayed level at 0.75: the flow of contracts kept pace with the flow of new and returning supply. In other words, demand didn’t spike—but it didn’t retreat either.
Price discovery continues, but there are subtle improvements. The share of listings with price reductions eased to 52% in August from 54% last year, implying slightly firmer list-price discipline or better initial pricing by sellers and their agents. Meanwhile, back-on-market (BOM) activity edged up to 21% with 818 BOM units, suggesting buyers remain choosy and inspection- or financing-sensitive, yet the market is still clearing enough volume to keep the ratio stable. Mortgage rates in the dataset hovered near 6.59% in August (vs. 6.50% a year ago), a negligible year-over-year headwind that didn’t materially change the absorption math.
Why this matters for the Austin real estate market: the ratio tends to lead prices because it captures demand pressure at the moment new supply hits the market. When the ratio rises, more of what’s newly available is getting tied up—often a precursor to firmer pricing later in the cycle. We’re not calling a price surge; we’re acknowledging a cleaner, more engaged tape in August that is consistent with stabilization. If this 0.75 plateau persists or rises into the fall, it strengthens the case for a steadier Austin real estate forecast heading into year-end.
For sellers, the message is to price to today’s market, not last spring’s wish list. With 52% of sellers still taking reductions, the properties that go under contract fastest are the ones that enter the market at the correct value on day one and show well in the first week. For buyers, patience and precision matter: a steady 0.75 means well-priced homes will see attention quickly, but choice hasn’t evaporated with 15,119 actives on the board. Strong terms, responsive timelines, and clean offers remain the edge in a market that’s absorbing, not frothy.
From a broker and agent operations standpoint, the ratio offers a forward-looking “pulse.” August’s 0.75 suggests open houses and lead follow-ups should convert more efficiently than in mid-spring when the ratio dipped to 0.64–0.65 (May–April). Pair that with tighter list pricing and better pre-market prep, and your pipeline math improves: fewer languishing listings, more predictable pendings, and cleaner turn times from first showing to contract. That is the type of micro-shift that shows up in pendings first, and in negotiated prices and days on market later.
The bottom line for the Austin housing market update: absorption improved to the best level since February even as inventory stayed high. It’s not a bullish breakout; it’s a constructive step toward balance. If September holds the line on a 0.75-type reading—or better—expect the fall Austin property market narrative to tilt from “price discovery” toward “selective firmness,” especially in segments with tight condition and competitive pricing.
Method note: how we compute the ratio
We add New Listings and Back-on-Market counts, then divide by the total of Active-Under-Contract plus Pending. For August that’s (3,829 + 818) ÷ (1,948 + 1,547) = 0.75. This construction is intentionally forward-looking and helps frame an Austin market forecast grounded in today’s absorption, not last month’s closings.
FAQ
What is the New Listing to Pending Ratio and why is it a leading indicator in Austin real estate?
It compares incoming supply (new plus back-on-market) to properties moving into contract (active-under-contract plus pending). Because it measures absorption at the moment new options hit the market, it typically shifts before closed prices, making it useful for short-term Austin housing forecast work.
Is Austin a buyer’s or seller’s market right now?
With 15,119 active listings and a 0.75 ratio, Austin sits in a balanced-leaning environment: buyers still have selection, and sellers who price correctly are getting traction. The 52% price-reduction share underscores that list-price precision still matters, but the absorption pace is no longer deteriorating, which is constructive for the Austin real estate market.
How did August compare to last year and to recent months?
August’s 0.75 matched last August and improved from 0.74 in July. New listings were slightly lower year over year (3,829 vs. 3,933), and in-contract totals were roughly similar (3,495 vs. 3,544), keeping the ratio steady despite a bigger active base (15,119 vs. 13,396). That mix argues for stabilization in the Austin property market.
What does a higher ratio mean for Austin home prices?
A rising ratio means a greater share of fresh supply is being captured by buyers. If that persists, it tends to firm negotiations and can slow the pace of price cuts. Given August’s flat year-over-year ratio but better month-over-month reading, the near-term Austin real estate trends lean toward stabilization rather than renewed declines.
How should sellers and buyers adjust strategy based on this metric?
Sellers should invest in pre-market readiness and price correctly to avoid joining the 52% still reducing. Buyers should be prepared to act quickly on well-priced, well-conditioned homes, where absorption is strongest. In both cases, watch the ratio: if it holds near or above 0.75, expect tighter negotiation ranges in the segments with the cleanest listings.
Related Articles
Keep reading other bits of knowledge from our team.
Request Info
Have a question about this article or want to learn more?
