
Austin Real Estate Forecast: August Pendings Stay Positive as Supply Eases
Published | Posted by Dan Price
Austin’s pendings didn’t just flash green—they stayed positive year over year every single day in August.
The Austin real estate market showed a clean, sustained improvement in demand through August. Pending listings registered positive year-over-year growth on every reporting day this month, culminating at 4,260 pendings on Monday, August 25, up 4.7% from the same day last year. The growth rate started the month in the low twos and gradually climbed into the mid-fours by mid to late August, a steady pattern that supports a data-driven austin housing forecast rather than a one-day anomaly.
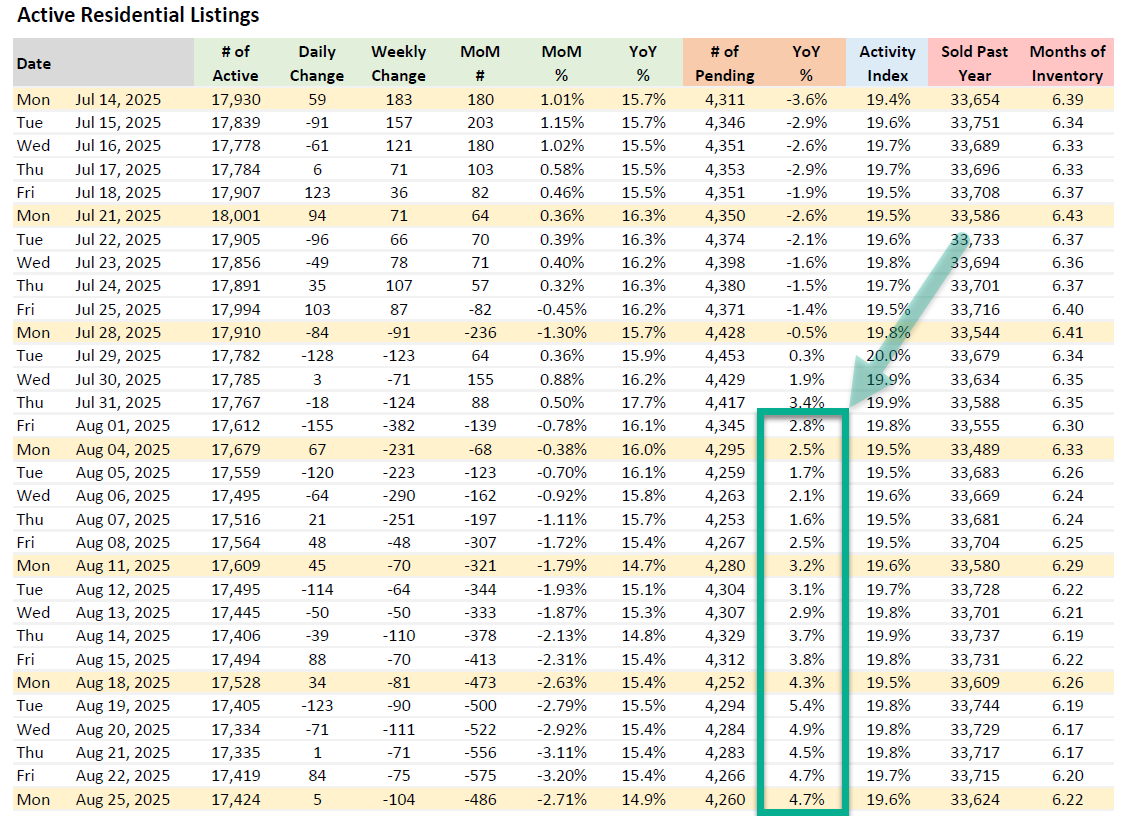
Demand strengthened while staying disciplined. Month-to-date, pending listings ranged from just over 4,250 to a local high of 4,329 on August 14. The year-over-year growth rate reached a monthly high of 5.4% on August 19 and averaged approximately 3.4% across the month so far, signaling consistent, broad-based absorption rather than a short-lived spike. In practical terms for the austin real estate market, the buyers who are active are moving on appropriately priced inventory, and the flow of accepted contracts is running ahead of last year’s pace.
Supply has been easing as the month progressed. Active residential listings opened August at 17,612 and stepped down to 17,424 by August 25, a 188-listing pullback month-to-date. On the report’s rolling basis, that translates to a 2.71% month-over-month decline as of August 25, even while active listings remain 14.9% higher than a year ago. The lowest active count this month printed on August 20 at 17,334 before edging higher into the final week, showing that supply has some give but is not collapsing. For the austin property market, that combination—more choices than last year, slightly fewer than earlier in the month—creates clearer pricing signals for both sides of the table.
Inventory conditions are hovering near balance and drifting modestly tighter. Months of inventory improved from 6.30 on August 1 to 6.22 on August 25, a small but directional decline that lines up with the month’s firmer pendings and softer active counts. Market velocity, as captured by the Activity Index, held in a narrow band around the upper-19s, including a 19.6 print on August 25. Together, these measures describe an austin housing market update that is active, negotiated, and gradually stabilizing rather than racing in either direction.
Short-cycle context matters when reading the prints. Late July closed with actives near the 17,800–17,900 range and months of inventory around 6.34 to 6.35. By mid to late August, actives settled closer to the mid-17,000s and months of inventory slipped a tenth, while pendings consistently outperformed last year’s daily counts. That progression is exactly what you want to see heading toward fall: slightly leaner supply, steadier absorption, and no signs of distorted pacing. It adds technical weight to an austin market forecast that favors normalization.
Implications for buyers are straightforward. With actives still higher year over year and months of inventory holding a little above six, buyers retain useful leverage—more selection and more negotiating room than in a tight market. Positive year-over-year pendings, however, tell you that well-positioned homes are finding buyers. If a property is priced to the most recent pending comps and shows cleanly, waiting for large concessions is less reliable than targeting homes with longer days on market or visible gaps in condition. That is how to navigate the current austin real estate trends using the data in front of you.
Sellers should treat pricing as a precision exercise. The market is rewarding alignment to today’s comparables, not yesterday’s list prices. When pendings run ahead of last year while actives drift lower during the month, buyers are focusing their offers on the inventory that looks “right” on day one. The properties that miss on price or presentation are cycling through reductions without achieving the same absorption. If your goal is to convert showings into offers in this austin real estate market, the cleanest route is accurate pricing, ready-to-sign disclosures, and polished presentation from the start.
Investors can read the tape as cautiously constructive. Absorption improved at the margin, supply eased month-to-date, and months of inventory nudged down—all markers of a market that is clearing at a measured pace. That mix supports selective acquisitions where underwriting can capitalize on fixable issues or motivated timelines. Expect the tightest spreads on the cleanest assets and better terms where sellers need to solve for condition, time, or clarity. The operative word for the austin real estate forecast remains “selective,” backed by month-long positive pendings and stable velocity.
The bottom line for Austin is balance by increments, not by leaps. August delivered the first full month of uninterrupted year-over-year growth in pendings alongside slightly lower month-to-date supply and a small improvement in months of inventory. Those three signals together describe a market edging toward equilibrium. For readers tracking the austin housing forecast, this is the kind of durable, data-first improvement that builds confidence in execution without overpromising on price direction.
Frequently asked questions.
Is Austin’s housing market getting stronger or weaker right now?
The market is getting modestly stronger by the measures that matter. Pendings were positive year over year every day in August and averaged about a 3.4% gain month-to-date, while months of inventory eased from 6.30 to 6.22 and active listings ticked down over the month. That is a steady improvement in absorption and a small tightening in supply, consistent with a stabilizing austin real estate market.
What does months of inventory tell us about bargaining power?
Months of inventory declined slightly in August, ending at 6.22 on August 25 after starting at 6.30 on August 1. In practice, that means buyers still have leverage from selection, but the negotiating gap narrows for well-positioned homes as absorption firms. Watching this measure alongside pendings helps calibrate expectations in the austin real estate report.
Are pending sales up because of a one-off event or broad demand?
The pattern suggests broad demand. Positive year-over-year pendings posted every day of August, with the growth rate progressively improving from the low twos to the mid-fours and a local high of 5.4% on August 19. That month-long cadence indicates consistent buyer engagement across the austin property market rather than a single shock.
How is supply trending compared with earlier this summer?
Supply drifted lower through August after running higher in late July. Active listings moved from roughly the upper-17,000s at the end of July to 17,424 by August 25, and the monthly low for actives landed at 17,334 on August 20. The month-over-month measure showed a 2.71% decline by August 25, consistent with a gentle easing in available inventory.
What should I watch next to gauge the Austin housing forecast?
Three daily signals are most useful: whether pendings continue to beat last year, whether active listings keep edging down on a rolling month-over-month basis, and whether months of inventory holds near or below its late-August level. If those align, the austin housing trends into early fall should continue to favor measured normalization rather than renewed softness.
Related Articles
Keep reading other bits of knowledge from our team.
Request Info
Have a question about this article or want to learn more?
