Austin Real Estate Market: Interpreting the Shift Through Months of Inventory – October 2025
As we finish October 2025, the Austin resale housing market continues to reveal its direction through one of the most reliable indicators of market balance — Months of Inventory (MOI). This measure, which calculates how long it would take to sell all current listings at the existing sales pace, now offers a clear snapshot of how supply and demand are realigning across the region. By analyzing Austin’s 30 cities and 75 ZIP codes through five distinct market phases — from Seller Acceleration to Buyer Control — we can see precisely where pricing power resides and how momentum is shifting as we close the month.
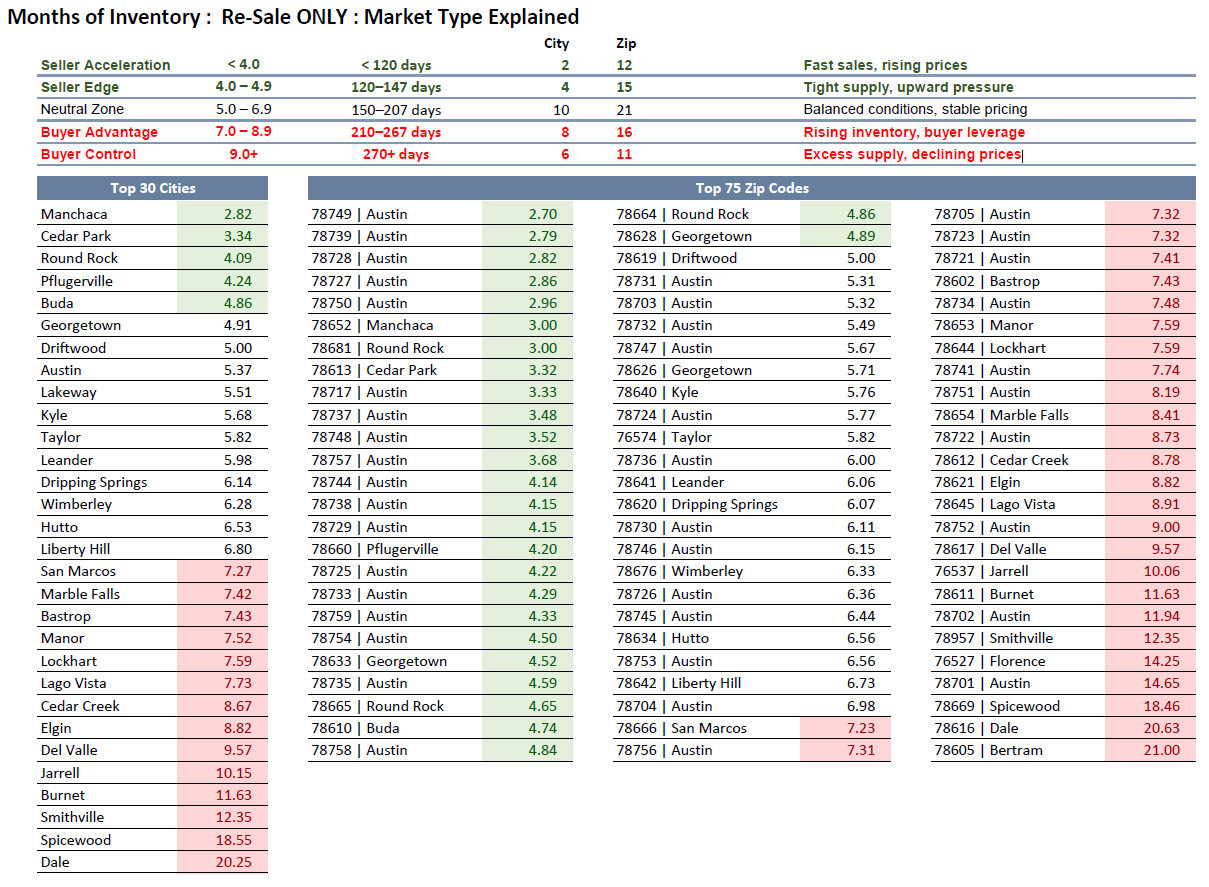
Seller Acceleration: Fast Sales, Rising Prices
Only 2 cities (6.7%) and 12 ZIP codes (16%) remain in the Seller Acceleration zone, defined as markets with less than 120 days of inventory. These are the most competitive micro-markets across Central Texas, where homes continue to sell quickly, often within four months, signaling that buyers are still chasing limited supply. Neighborhoods such as 78749 (Southwest Austin) and Manchaca exemplify this phase, maintaining strong absorption despite broader regional softening. Price stability here remains firm, and sellers retain meaningful leverage, particularly for homes that are move-in ready and priced correctly from day one.
These pockets of acceleration tend to appear in mature, established areas with consistent demand drivers — proximity to employment centers, reputable schools, and limited new construction. The takeaway is that even within a cooling metro environment, select Austin submarkets are still outperforming, offering valuable reference points for both buyers and agents seeking benchmarks of strength.
Seller Edge: Tight Supply, Upward Pressure
The next tier, Seller Edge, represents markets with 120–147 days of inventory — roughly four to five months of supply. In this range, 4 cities (13.3%) and 15 ZIP codes (20%) show continued tightness, though not at the frenzied pace of 2021–2022. Communities such as 78727, 78728, and 78750 fall here, with listings absorbing at a steady clip, supporting modest upward pressure on prices.
Seller Edge markets reflect the “last holdouts” of seller-favoring dynamics in today’s Austin housing environment. They tend to be areas with mid-tier pricing and strong commuter access — properties priced right still move, but aspirational pricing is being disciplined by buyer selectivity. Sellers in these ZIPs still hold an edge, but their window to capitalize may narrow as more listings accumulate through Q4.
Neutral Zone: Balanced Conditions, Stable Pricing
The Neutral Zone, encompassing 150–207 days of inventory, now includes 10 cities (33.3%) and 21 ZIP codes (28%) — the largest share of the Austin market. This category signals balanced conditions where neither side has a strong advantage. Cities like Round Rock, Buda, Georgetown, and Lakeway sit near the middle of the spectrum, with MOI readings between 5 and 6.5 months.
Balanced markets are typically characterized by more predictable transaction timelines, reasonable negotiation margins, and stable pricing trends. While this equilibrium offers less volatility, it also marks a pivotal transition: many of these areas were solid seller markets just 18 months ago. Today, they’re operating on a knife’s edge — one uptick in supply or one slowdown in demand could push them into buyer-favored territory before year-end. For agents and investors, this phase often represents opportunity: price stability provides reliable comparables and clearer indicators of fair market value.
Buyer Advantage: Rising Inventory, Buyer Leverage
When inventory stretches between 210–267 days, the market enters Buyer Advantage territory. This segment now covers 8 cities (26.7%) and 16 ZIP codes (21.3%). Key examples include San Marcos, Marble Falls, Bastrop, and Manor — markets where supply is outpacing absorption, granting buyers more leverage in negotiations.
These areas often feature a combination of new construction competition and affordability-driven migration patterns. Builders are increasing incentives, resale listings linger longer, and price reductions are becoming more common. The tone here shifts from “multiple offers” to “measured offers.” Buyers are negotiating for closing costs, repair credits, or rate buydowns, while sellers are being forced to adjust to a slower absorption cycle. For sellers in these ZIPs, pricing alignment with market velocity is now critical — waiting too long to adjust can cost momentum and net proceeds.
Buyer Control: Excess Supply, Declining Prices
At the far end of the spectrum lies Buyer Control, defined by markets exceeding 270 days of inventory. Six cities (20%) and 11 ZIP codes (14.7%) now fall into this category, where excess supply and longer selling timelines are putting clear downward pressure on prices. Locations such as Del Valle (9.57 months), Jarrell (10.15), and Smithville (12.35) illustrate the extremes of this phase — high inventory combined with affordability headwinds and slower absorption.
These conditions create significant negotiation power for buyers and investors seeking value. While pricing weakness in these markets might appear negative, it also signals potential entry opportunities for long-term investors who understand cyclical recovery. Historically, Buyer Control zones often precede price stabilization within 6–12 months once excess supply is cleared, particularly in outer-ring markets.
Market Perspective: The Path Forward
As October 2025 comes to a close, Austin’s resale market presents a layered narrative — not a crash, but a redistribution of leverage. The majority of the metro area is now either balanced or buyer-leaning, with just 20% of cities and 36% of ZIP codes still holding a seller’s advantage. For agents, this means recalibrating client expectations toward negotiation strategies, not bidding wars. For buyers, it’s a moment of re-entry — selection has improved, timelines have normalized, and value opportunities are returning.
The story of the next six months will likely depend on inventory flow versus absorption. Should active listings continue to rise through the winter without a corresponding increase in demand, more markets will slip into Buyer Control. Conversely, any meaningful drop in new listings or uptick in pending contracts could stabilize MOI across key ZIP codes heading into spring 2026. Either way, the data makes one truth clear: the Austin housing market has transitioned from momentum-driven to data-driven — and that’s where opportunity begins.
FAQ
1. What does Months of Inventory tell us about the Austin housing market?
Months of Inventory (MOI) shows how long it would take to sell all homes on the market given current demand. It’s the most accurate indicator of supply-demand balance — under 5 months favors sellers, 5–7 months is balanced, and over 7 months favors buyers.
2. Which Austin areas are still considered strong seller markets?
Neighborhoods such as 78749, 78728, and Manchaca remain competitive, with less than four months of inventory. Homes in these zones tend to sell faster, often with multiple offers when priced accurately.
3. Where are prices most likely to decline next?
Outer-market ZIP codes like Del Valle, Jarrell, and Smithville are already showing high MOI levels and are most at risk for price erosion through Q4 2025 if demand continues to lag.
4. What should sellers do in Neutral or Buyer Advantage markets?
Sellers in these zones should focus on pricing alignment and presentation. Homes that show well and enter the market competitively priced are still moving — overpricing risks stagnation and further reductions.
5. How can buyers use this data to their advantage?
Buyers should identify ZIP codes with over 7 months of inventory. These markets offer the most negotiation power, potential seller concessions, and slower absorption rates, giving buyers more leverage in timing and price.