Austin vs. The Nation: What Inflation-Adjusted Home Prices Really Tell Us
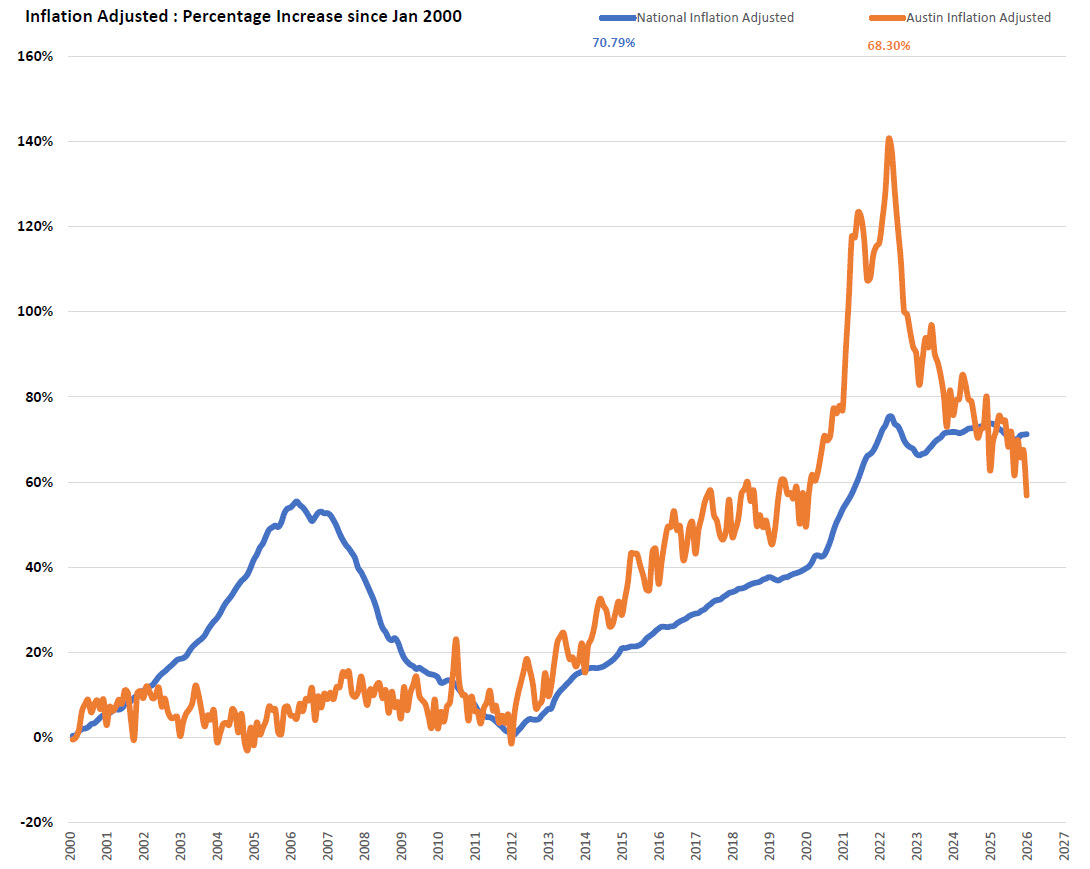
The numbers look nearly identical today. The story of how we got here is anything but. On the surface, the inflation-adjusted scoreboard looks like a tie. Since January 2000, national home prices have risen 70.79 percent in real terms. Austin has gained 68.30 percent. Two markets. Twenty-six years. Almost identical results. But the path those two lines took to get here is one of the most dramatic stories in modern American real estate — and it has direct implications for every homeowner, buyer, and investor in the Austin area today.
The Quiet Decade, Then the Explosion
From 2000 through roughly 2013, Austin and the national market moved in relative lockstep. Both absorbed the Great Recession. Both bottomed out around 2011 to 2012. Both began a slow, grinding recovery as the economy stabilized and mortgage rates hit historic lows.
Then, around 2014, Austin began to separate from the pack. Population growth accelerated. The tech sector expanded. Remote work unlocked demand from coastal markets. Buyers who had been priced out of San Francisco and Seattle found Austin not just affordable — they found it cheap. Inventory couldn't keep up. Prices ran.
By early 2022, Austin's inflation-adjusted gains since 2000 had reached nearly 140 percent — roughly double the national average at the time. The national market, for all its momentum, had peaked near 76 percent in real terms. Austin had lapped it twice. At the 2022 peak, Austin was running 70 percentage points ahead of the nation in inflation-adjusted gains. Today that gap has closed to just 2.5 points.
What the Correction Actually Looked Like
The May 2022 national peak marked the turning point. Mortgage rates moved from the low 3s to the high 6s and beyond within months. Affordability collapsed. Transaction volume seized. And markets that had run the hardest gave back the most.
Austin fell sharply. The same characteristics that fueled the surge — speculative demand, investor activity, thin local buyer base at elevated prices — accelerated the retreat. By late 2023 and into 2024, inflation-adjusted Austin gains had dropped from that 140 percent peak to territory that now sits below the national line.
The national market, by contrast, barely flinched. Measured by the inflation-adjusted HPI/CPI index, the U.S. has declined only about 2.3 percent from its May 2022 peak as of the most recent March 2026 data. No systemic crisis. No forced liquidation wave. A slow, controlled exhale — not a collapse.
The Current Correction in Context — March 2026 :
- -2.3% : National real-price decline from May 2022 peak
- 44 mo. : Length of current national correction cycle
- -35.2% : Real-price decline during the 2006–2012 correction
The contrast with 2006 to 2012 is important context. That correction ran 71 months and erased more than a third of inflation-adjusted value nationally. The current cycle is 44 months in and has given back a fraction of that. The structural backdrop is simply different — stronger underwriting, minimal distressed inventory, historically high homeowner equity, and no forced selling dynamic driving a cascade.
What This Means for Austin Homeowners
If you bought in Austin before 2019, you almost certainly still hold substantial real gains. The market ran so far above historical norms during 2020 to 2022 that even after a significant correction, long-term owners remain well ahead of inflation. The question is not whether you lost wealth — most didn't. The question is how your specific property, neighborhood, and price point performed relative to the broader trend.
If you bought near the 2021 to 2022 peak, your picture is more nuanced. Nominal prices in many Austin submarkets remain below their highs. Inflation has done some of the work of closing the gap over time, but patience remains the operating principle. This is not the market to sell under duress. Owners who can hold are in a structurally sound position — even if it doesn't feel that way when comparing to peak values.
What This Means for Buyers
The data makes a compelling case that the worst of the affordability shock is likely behind us, even if rates remain elevated near term. Austin's inflation-adjusted gains have now converged with the national average after years of dramatic outperformance. That convergence suggests the speculative premium has been largely wrung out of the market.
This is not a prediction that prices will spike again imminently. Supply constraints, demographic demand, and Austin's long-term growth trajectory do, however, provide a structural floor that makes the market meaningfully different from a market in secular decline. Buyers who are purchasing for the right reasons — principal residence, long hold period, sustainable financing — are entering at a far more rational point than 2021 buyers were.
What This Means for Investors
The long-term inflation-adjusted return on Austin real estate since 2000 — approximately 68 percent in real terms — is a meaningful number. It confirms that housing in high-growth metros compounds real wealth over time, even when measured conservatively against inflation. The volatility of the 2020 to 2026 cycle obscures a durable underlying trend.
Disciplined investors evaluating Austin today are looking at a market that has reset valuations, reduced speculative froth, and maintained structural demand drivers. The liquidity-driven surge is over. The next phase will reward patience, selectivity, and fundamentals-based underwriting over momentum chasing.
The Bottom Line : Two lines on a chart ended up in nearly the same place. But Austin took a rocket ship to get there — and the national market took an escalator. Understanding that difference is what separates reactive decision-making from data-driven strategy. The inflation-adjusted story isn't bearish or bullish in isolation. It's honest. And in a market where opinions are loud and data is often cherry-picked, honesty is the edge. Track the Full National Market Index : Updated monthly with the latest inflation-adjusted home price data, cycle comparisons, and Austin-area context.