Austin Housing Market Update – October 2025
As of mid-October 2025, the Austin-area housing market continues to balance between stabilization and adjustment. The latest data from the Austin-Area MLS shows 16,445 active residential listings and 3,953 pending properties, resulting in an Activity Index of 19.38%. This metric, which measures buyer engagement relative to total active listings, highlights a market that remains active but no longer overheated.
Supply Levels and Market Balance
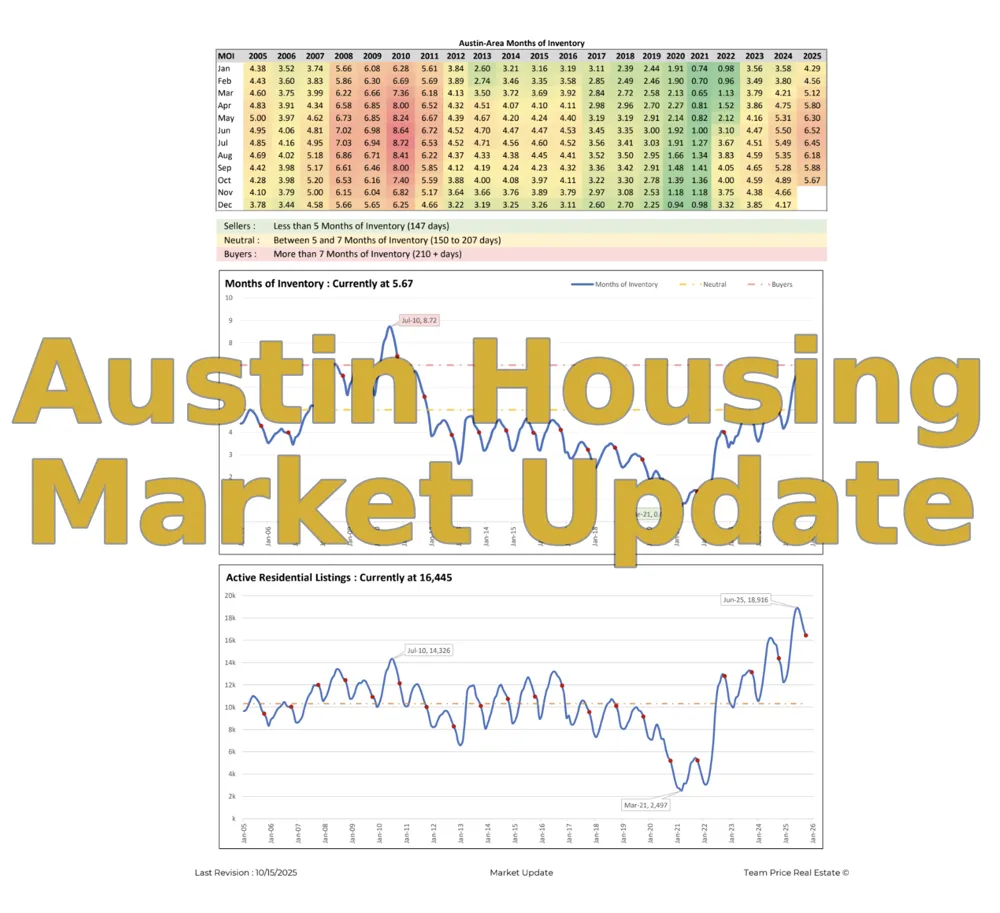
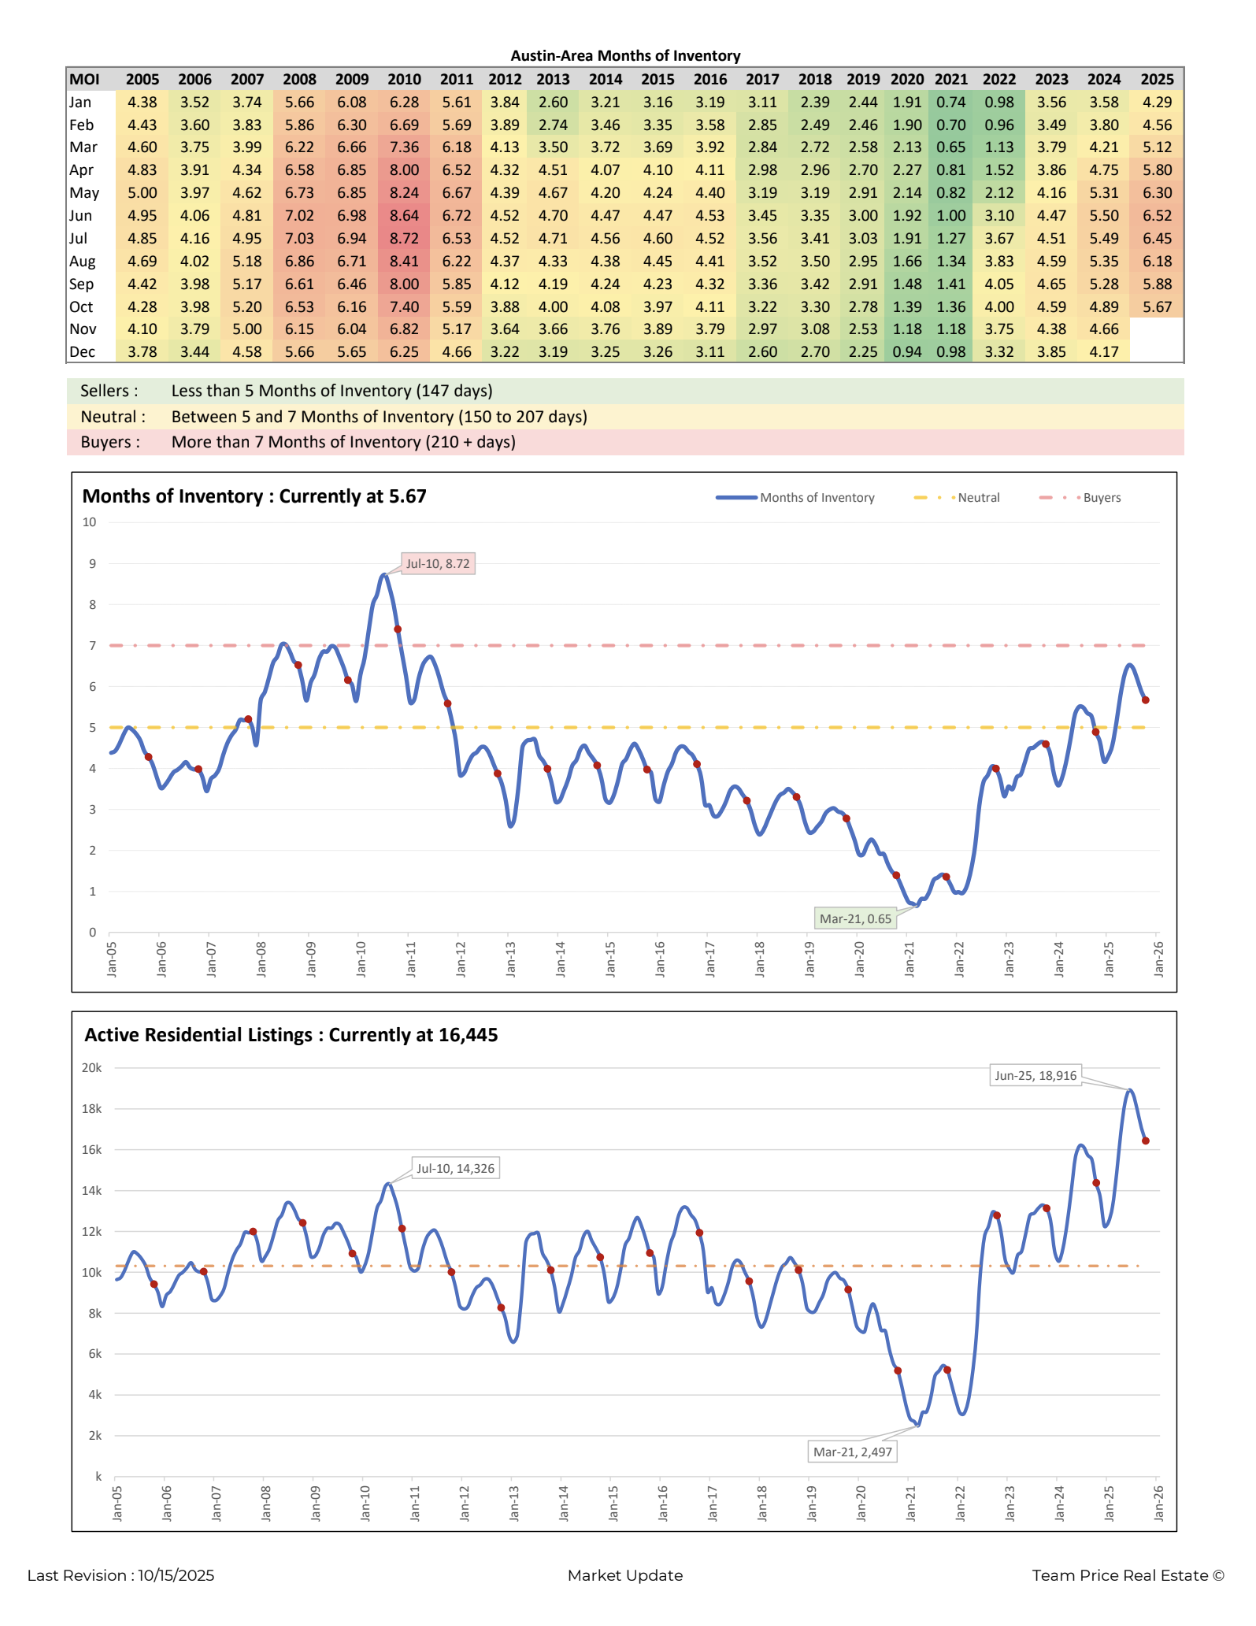
The months of inventory across Central Texas currently ranges from 2.05 to 11.00 months, with the overall Austin-area figure at 5.7 months. This places the market in neutral territory—neither firmly favoring buyers nor sellers. Historically, Austin’s market has experienced more extreme swings: the record low occurred in March 2021 at just 0.65 months, while the high point was 8.72 months in July 2010. The current level represents a return to a more balanced environment after several years of volatility.
The accompanying inventory chart shows that after bottoming out during the pandemic boom, active listings began to rise sharply in 2023 and 2024 before stabilizing this year. The current count of 16,445 active homes remains elevated compared to historical averages, but lower than the June 2025 peak of 18,916. This reflects a gradual normalization in supply as new listings and absorption rates realign.
Pricing and Affordability
The median sold price in the Austin-area is now $450,000, with the average sold price at $615,657. Both figures represent a meaningful correction from the May 2022 market peak, when the average sold price reached above $750,000. The current level marks an 18.18% decline from that peak, bringing pricing back in line with pre-pandemic growth trends.
Despite the decline in average prices, Austin’s price per square foot remains one of the highest in Texas due to ongoing population inflows, job growth, and demand for quality housing stock. This adjustment phase is helping restore affordability to segments of the market that had been largely priced out in recent years.
Buyer and Seller Behavior
Homes are now spending an average of 71 days on market, reflecting slower absorption compared to the rapid turnover of 2021–2022. Additionally, 59.17% of active listings have recorded at least one price reduction, underscoring a more price-sensitive environment. Sellers are increasingly adjusting expectations to align with buyer affordability thresholds amid elevated financing costs.
The sold-to-list price ratio currently stands at 97.20%, suggesting that while negotiation margins have widened, well-priced listings continue to sell near their asking values. For buyers, this translates into increased leverage and opportunity, while for sellers, strategic pricing and presentation remain key to attracting serious offers.
Broader Context
Across the 30 cities in Central Texas, inventory diversity remains wide—some submarkets are still tight with as little as two months of supply, while others are closer to eleven months. This variation underscores the importance of local market expertise. Areas with balanced inventory, especially between four and six months, are likely to see more stable pricing and quicker transactions through the remainder of 2025.
While the Austin market has cooled from its pandemic highs, the data signals a more sustainable pace of activity. Moderate inventory, normalized pricing, and ongoing buyer demand continue to characterize the region’s transition into a mature, data-driven marketplace.