Austin Housing Market Inventory Update: September 2025
The September 2025 housing market update reveals striking shifts in inventory across Central Texas cities, with wide year-over-year variations. The data measures months of inventory (MOI), a key indicator of housing supply relative to demand, comparing September 2024 to September 2025 and tracking changes since the beginning of the year.
Year-Over-Year Trends
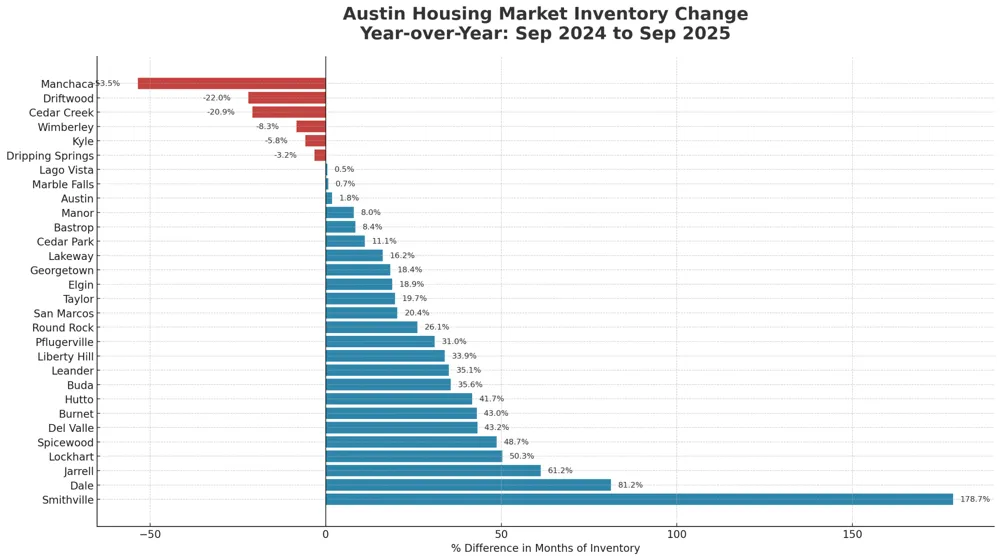
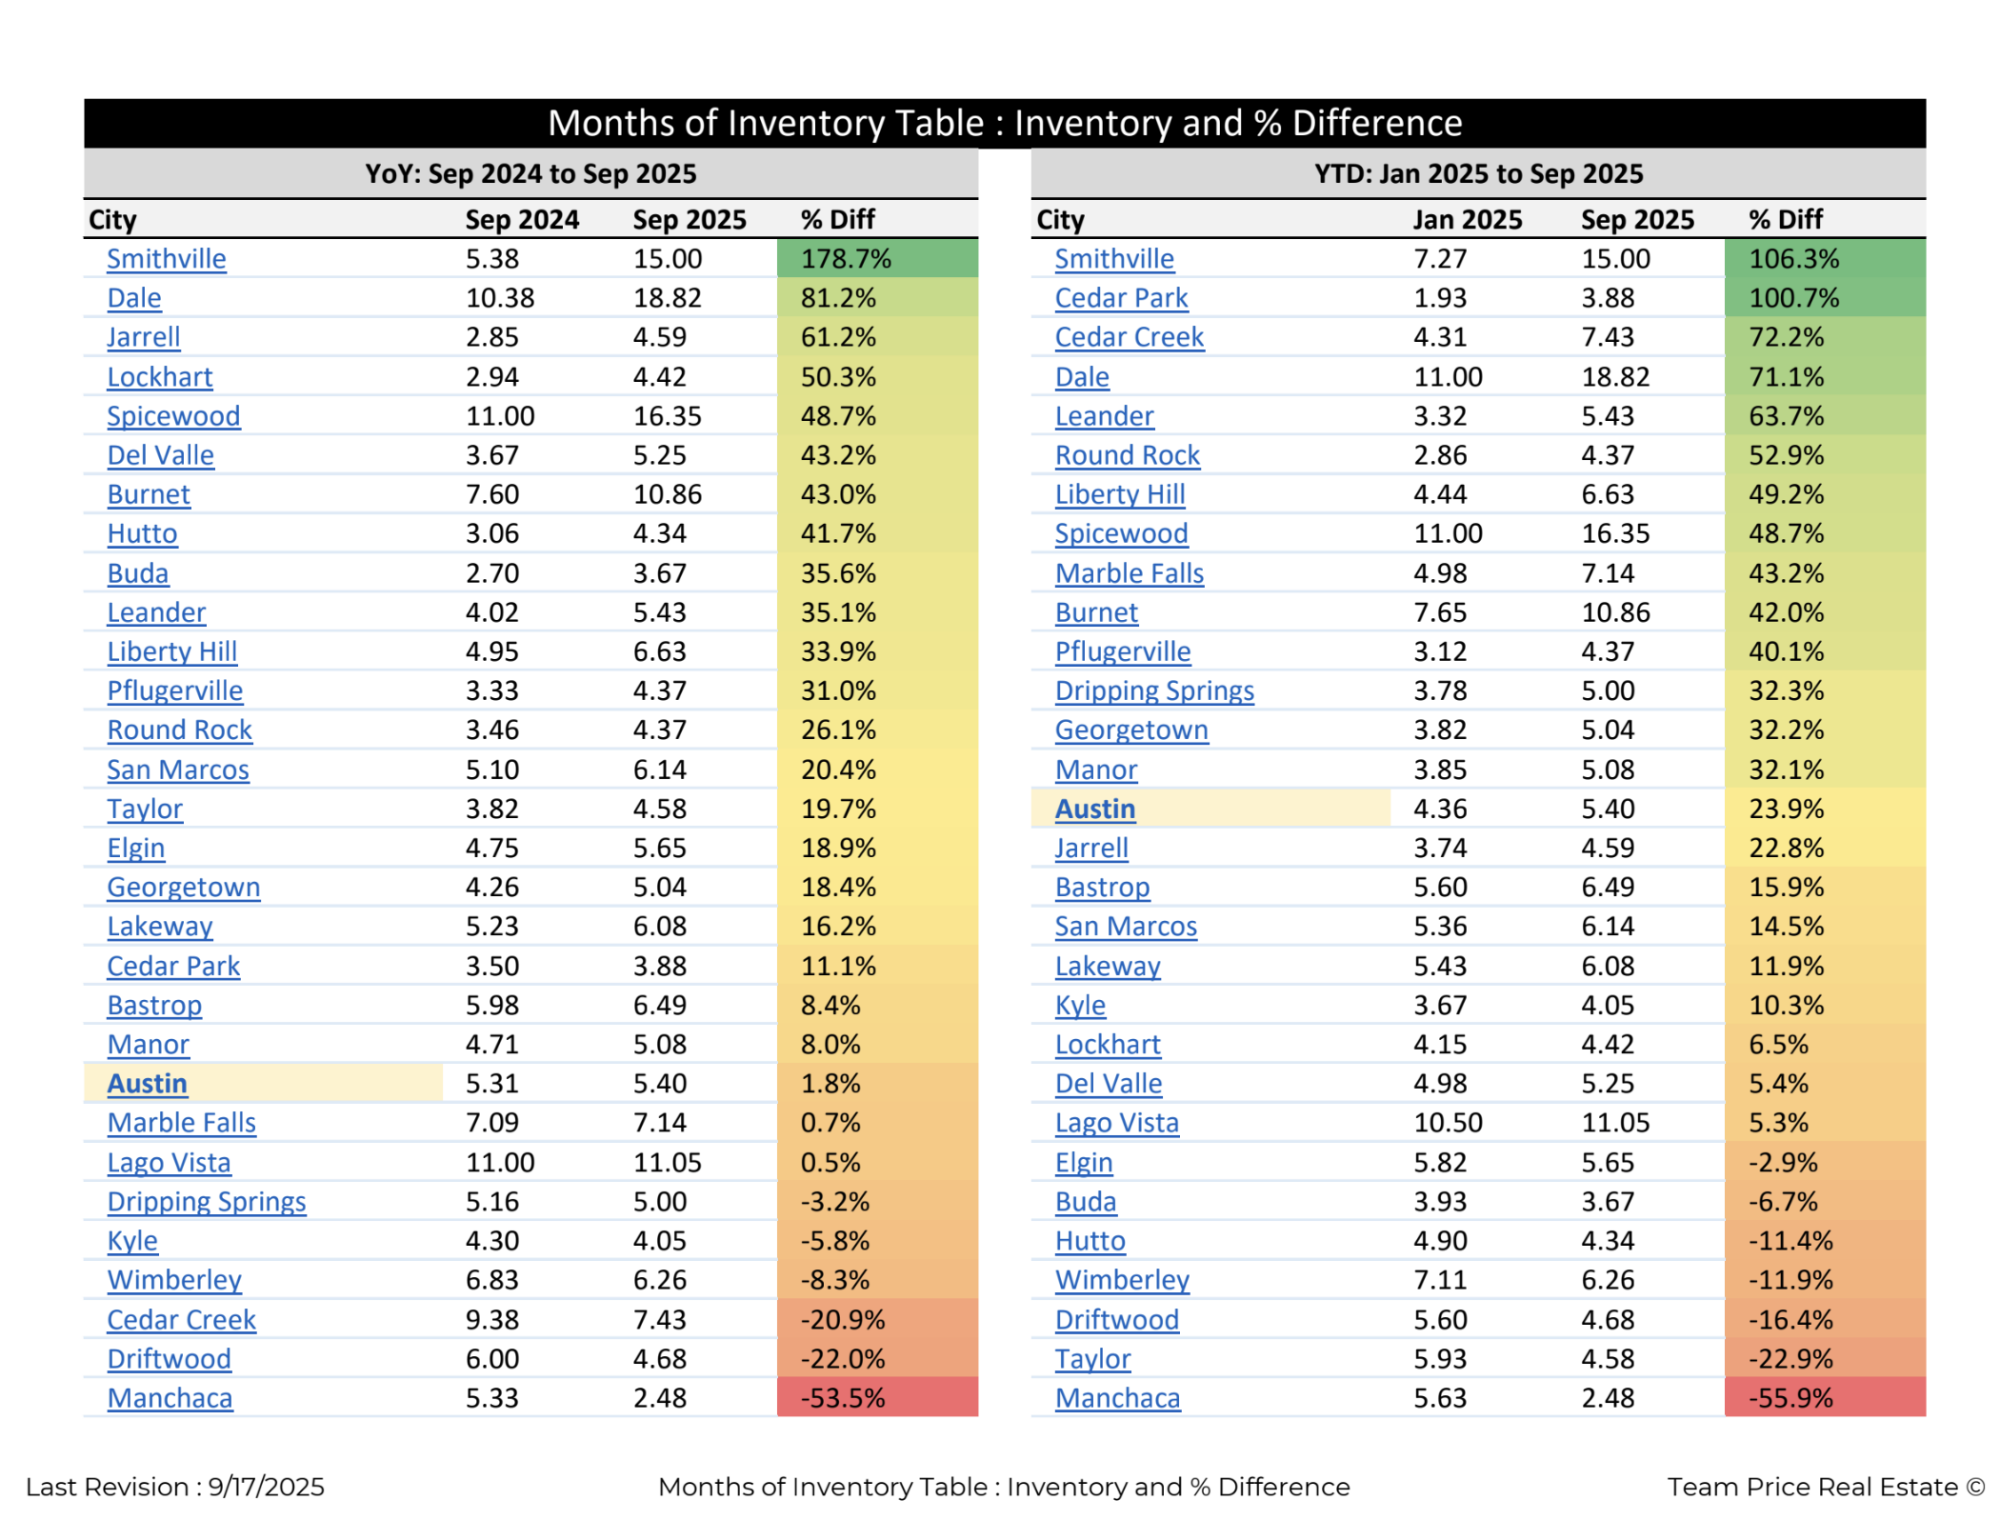
Smithville recorded the most dramatic increase in supply, with inventory climbing from 5.38 months in September 2024 to 15.00 months in September 2025, representing a 178.7 percent surge. Dale followed with an 81.2 percent increase, while Jarrell rose 61.2 percent, and Lockhart grew 50.3 percent. Other notable increases occurred in Spicewood, Del Valle, and Burnet, each posting more than 40 percent growth in inventory.
Cities such as Hutto, Buda, and Leander also saw double-digit increases, with gains between 35 and 42 percent. Liberty Hill and Pflugerville grew by 33.9 percent and 31.0 percent respectively, while Round Rock and San Marcos showed more modest gains near 20 percent.
At the lower end of year-over-year changes, Austin’s supply held nearly flat, rising just 1.8 percent from 5.31 to 5.40 months. Marble Falls and Lago Vista showed negligible changes of 0.7 percent and 0.5 percent, respectively. In contrast, several markets reported declines. Manchaca experienced the largest drop, with inventory falling 53.5 percent, while Driftwood decreased 22.0 percent and Cedar Creek fell 20.9 percent. Wimberley, Kyle, and Dripping Springs also posted slight declines between 3 and 8 percent.
Year-to-Date Shifts
Looking at changes since January 2025, the data confirms similar themes. Smithville again leads with a 106.3 percent increase, moving from 7.27 to 15.00 months of inventory. Cedar Park doubled from 1.93 to 3.88 months, while Cedar Creek and Dale posted increases of 72.2 percent and 71.1 percent, respectively. Leander climbed 63.7 percent, Round Rock rose 52.9 percent, and Liberty Hill grew 49.2 percent.
Other cities, including Spicewood, Marble Falls, and Burnet, showed steady increases of more than 40 percent. Austin rose 23.9 percent year-to-date, while Georgetown, Manor, and Dripping Springs all gained more than 30 percent.
On the opposite end, Manchaca declined sharply by 55.9 percent since January, while Taylor dropped 22.9 percent. Driftwood fell 16.4 percent, Wimberley dropped 11.9 percent, and Buda declined 6.7 percent. These reductions highlight the uneven distribution of supply shifts across the region.
Market Interpretation
The broader pattern illustrates that while many markets are experiencing expanded supply, a handful of submarkets are contracting. Rising months of inventory in areas such as Smithville, Dale, and Cedar Creek suggest slower absorption and greater buyer leverage. Meanwhile, declining figures in Manchaca and Driftwood point to tightening conditions where demand may be outpacing new supply.
For Austin, the relative stability—just a 1.8 percent increase year over year and a 23.9 percent gain year to date—reflects a market holding near balance. With months of inventory just above five, Austin remains in the neutral range, though nearby cities are experiencing more dramatic swings.