Austin-Area Investor Briefing: Lease and Sales Market Snapshot (August 27, 2025)
The Austin-area real estate market continues to present a mix of opportunities for investors evaluating both lease performance and residential sales. The latest data, updated through August 27, 2025, highlights key trends across multiple cities and zip codes, including rents, home prices, and the balance of supply and demand.
Lease Market Conditions
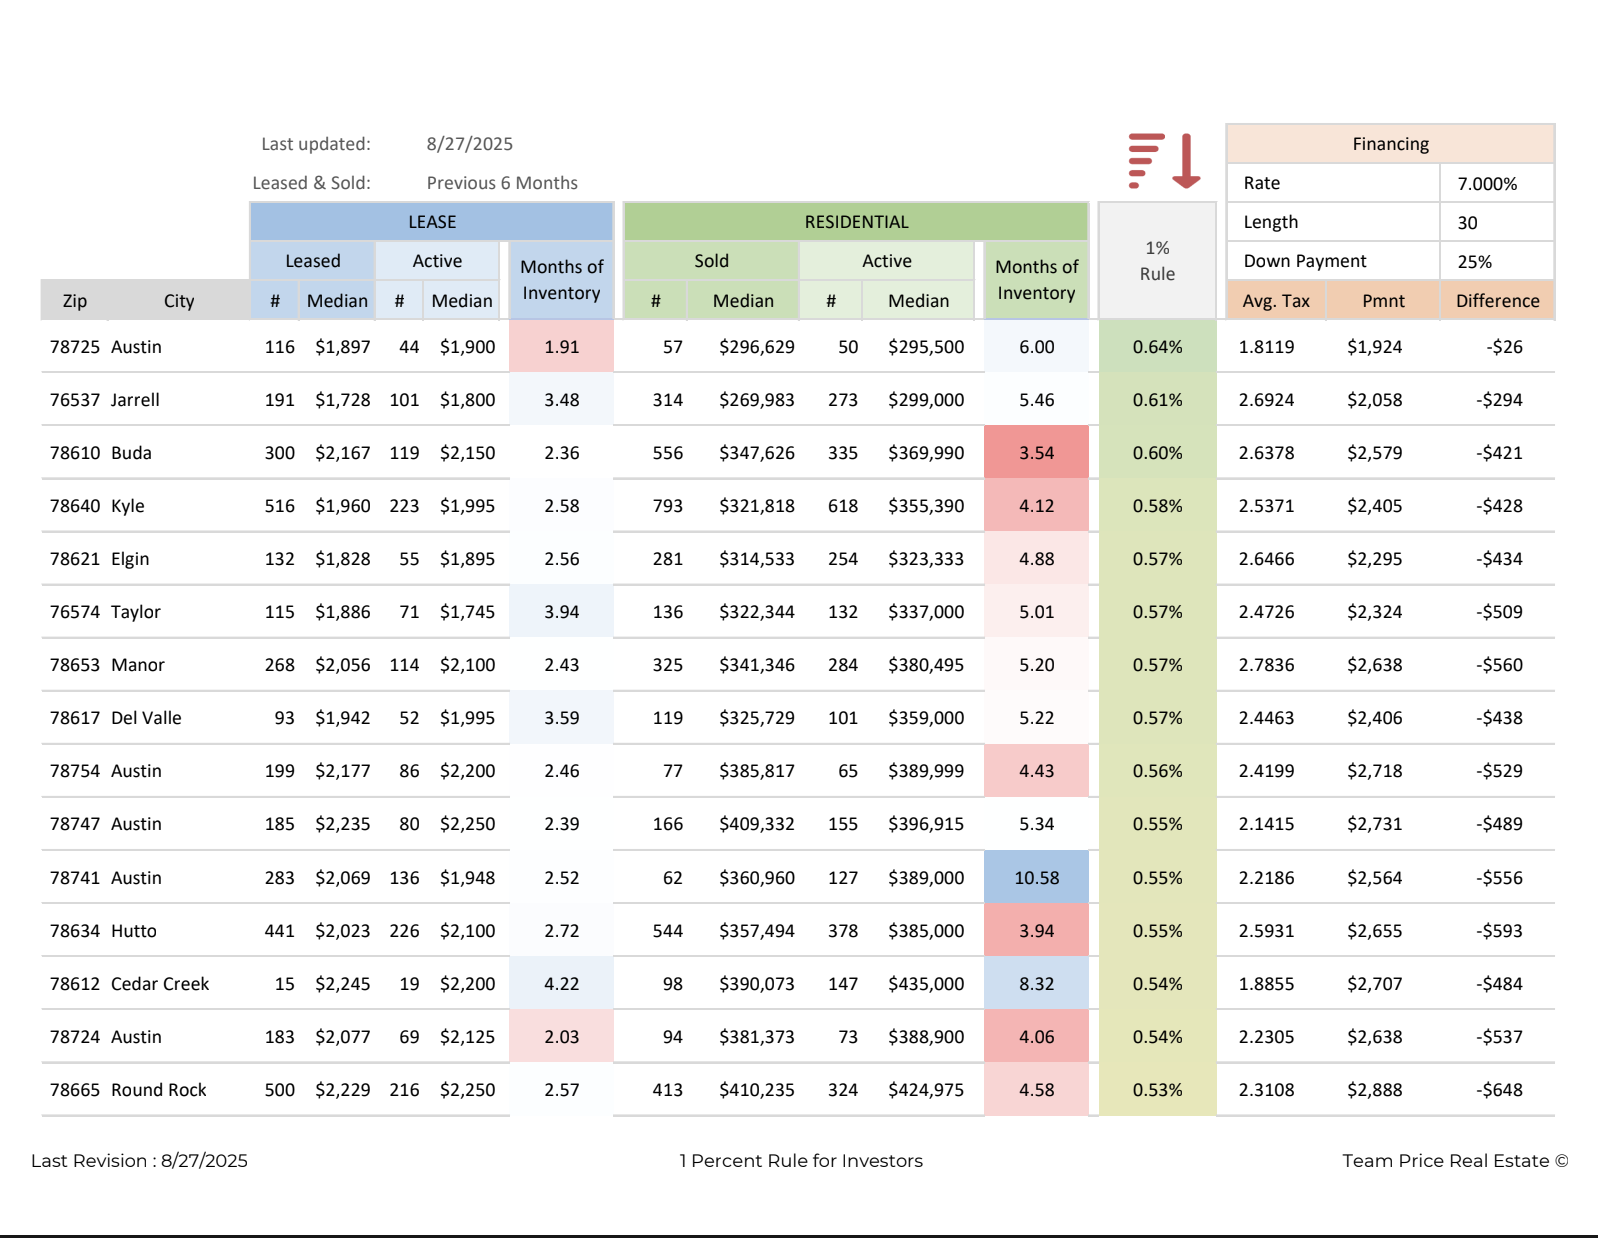
Rental activity across the region shows steady demand, with median lease rates ranging from $1,745 in Taylor to $2,250 in Round Rock and parts of Austin. The months of inventory on the lease side remain tight in many areas, with some markets such as the 78725 zip code showing just 1.91 months of lease inventory available. Generally, lease inventory below three months signals strong absorption and a landlord-favored environment. Round Rock, Buda, and Kyle also report low lease inventory at or below 2.6 months, reinforcing rental demand in those locations.
Residential Sales Trends
On the sales side, conditions vary significantly by city. In Austin’s 78725 zip code, for example, 57 homes sold over the past six months at a median price of $296,629, while the current active median is $295,500, creating about six months of supply. By contrast, 78634 (Hutto) shows over ten months of supply, and 78612 (Cedar Creek) reports 8.32 months of supply. These higher inventory levels indicate slower absorption, requiring sharper pricing and longer holding periods.
Across the region, median sales prices span from $269,983 in Jarrell to $424,975 in Round Rock. Several suburban markets including Buda, Kyle, and Manor have active inventory levels in the 3.5 to 5.2 month range, reflecting a balanced to leaning-buyer market. Investors should note that markets closer to the five-month mark provide negotiating leverage, while those below three months are more competitive for buyers.
Understanding the 1% Rule
The 1% Rule is a simple guideline investors often use to screen potential rental properties. It suggests that for a property to generate solid cash flow, the monthly rent should equal at least 1% of the purchase price. For example, if a home costs $300,000, the rent should be around $3,000 per month to meet the 1% threshold. While not a guarantee of profitability, it provides a quick way to judge whether a property is likely to cover expenses such as mortgage payments, taxes, insurance, and maintenance.
Looking at today’s data, none of the Austin-area markets fully meet the 1% Rule. The ratios range between 0.53% and 0.64%, meaning most homes are generating rents that are well below the 1% target compared to their purchase prices. For instance, in the 78725 zip code, the median home price is around $296,629, but the median lease is $1,897, yielding only 0.64% against the purchase price. Similarly, in Round Rock, the 78665 zip code shows a median home value of $410,235 but median rent of $2,229, creating a ratio of just 0.53%.
Financing and Payment Gaps
At a 7% interest rate with 25% down over 30 years, most scenarios show a monthly payment higher than the rent collected. The differences range from a modest shortfall of $26 in 78725 to larger gaps exceeding $600 in Round Rock. This negative cash flow highlights the need for investors to balance long-term appreciation goals with short-term rental performance.
Investor Takeaway
The current Austin housing and rental data illustrates a market in transition. While lease demand remains strong in several submarkets, home prices relative to rents limit immediate cash flow under traditional financing assumptions. Investors seeking positive cash flow will need to target properties with unique rent potential, consider larger down payments, or pursue value-add opportunities. At the same time, areas with stronger lease absorption, such as Austin’s 78725 and Buda’s 78610, offer stable tenant demand that can support long-term strategies even if initial yields fall short of the 1% Rule.
For investors committed to Austin, this snapshot underscores the importance of using local data to guide decisions. Tracking months of inventory, sales activity, and rental ratios at the zip code level will remain critical for identifying where returns align with investment goals.