• Sign Up
  • Log In
Jo Leung
Jo Leung
    • Market Report
    • Newsletter
    • Areas
      • Hutto
      • Fort Hood
      • Buda
      • Bastrop
      • Barton Hills
      • Round Rock
      • Cedar Park
      • Austin
      • Westlake Hills
      • Tarrytown
      • Crestview
      • Downtown Austin
    • Search
      • Search Properties
      • Featured Properties
    • Statistics
    • Articles
      • My Articles
      • Team Price Articles
    • Market Update
    • About
      • Meet Jo Leung
      • About Team Price
      • Testimonials
    • Contact
    • Jo Leung
    • Team Price Real Estate
      7320 N Mo-Pac
      Austin, TX 78731
      (512) 213-0213
      dan@teamprice.com

    Search

    • Search Properties
    • By City
    • By Subdivision
    • By Zip

    Explore

    • Featured Properties
    • Areas
    • Property Search

    Company

    • Guarantee
    • Work with Us
    • Interview Questions
    • Join Our Team

    Resources

    • Insight and Statistics
    • Tenant Pre-Screening
    • Real Estate Forms
    • Real Estate Glossary

    About

    • Home
    • About
    • Agents
    • Testimonials
    • Contact Us

    Account

    • Login
    • Sign Up
    Jo Leung - Footer Logo
    • Texas Real Estate Commission Information About Brokerage Services
    • Texas Real Estate Commission Consumer Protection Notice
    • Privacy
    • Terms
    • DMCA
    • Accessibility
    • Fair Housing
    © 2025 Team Price Real Estate. All rights reserved.
    Website built by CloseHack.
    Central Texas Multiple Listing Service

    Central Texas MLS | Four Rivers Association of REALTORS® All information deemed reliable but not guaranteed. All properties are subject to prior sale, change or withdrawal. Neither listing broker(s) or information provider(s) shall be responsible for any typographical errors, misinformation, misprints and shall be held totally harmless. Listing(s) information is provided for consumer's personal, non-commercial use and may not be used for any purpose other than to identify prospective properties consumers may be interested in purchasing. The data relating to real estate for sale on this website comes in part from the Internet Data Exchange program of the Multiple Listing Service. Real estate listings held by brokerage firms other than Jo Leung may be marked with the Internet Data Exchange logo and detailed information about those properties will include the name of the listing broker(s) when required by the MLS. Copyright ©2022 All rights reserved.

    Austin Board of Realtors

    The information being provided is for consumers' personal, non-commercial use and may not be used for any purpose other than to identify prospective properties consumers may be interested in purchasing. Based on information from the Austin Board of REALTORS®. Neither the Board nor ACTRIS guarantees or is in any way responsible for its accuracy. All data is provided "AS IS" and with all faults. Data maintained by the Board or ACTRIS may not reflect all real estate activity in the market.

    • MLSGrid IDX Data Notice
    • DMCA Notice
    Weekly Residential Market Update: October 2024 Trends in Listings, Sales, and Mortgage Rates

    Trends in Listings, Sales, and Mortgage Rates

    Published 10/30/2024 | Posted by Jo Leung

    ​

    Weekly Residential Update: A Closer Look at Recent Market Activity

    The residential real estate market has shown significant activity over the past few months, as indicated by the latest Weekly Residential Update. This data provides insight into new listings, pending sales, mortgage rates, and open house numbers, allowing us to understand how the market has evolved.

    ​

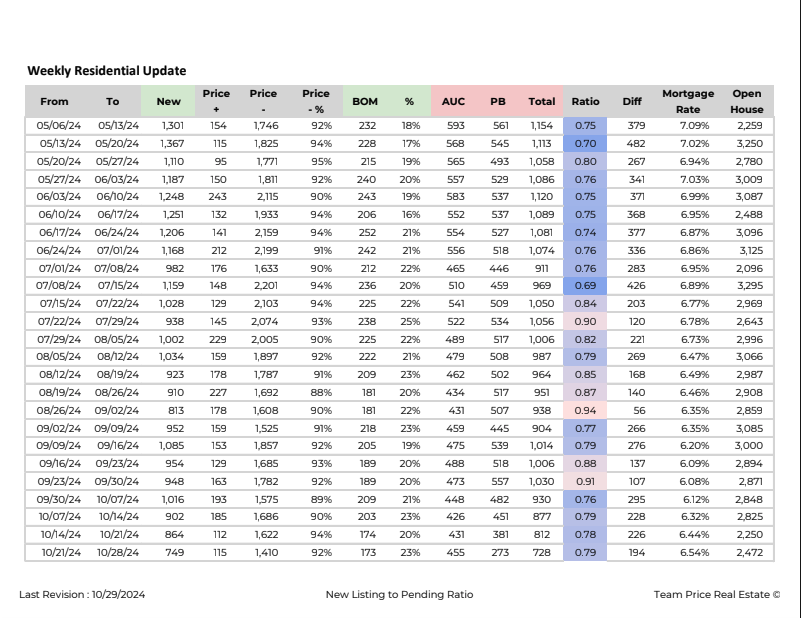
    Starting from May 2024, we observe a steady stream of new listings and pending ratios. For instance, during the week from May 6 to May 13, 1,301 new properties entered the market, with 154 price adjustments and a pending sales count of 1,746. The back-on-market (BOM) rate was 92%, and the average percentage of properties under contract (AUC) was 18%. During this time, the mortgage rate stood at 7.09%, and the market saw 2,259 open houses.

    Moving further into the data, by the week of June 3 to June 10, new listings increased slightly to 1,248, while price changes reached 243. The pending sales count peaked at 2,115, showing that the market was seeing an upswing in buyer interest. The BOM rate during this period remained steady at 90%, while the AUC was 19%, showing a consistent rate of sales activity. The mortgage rate slightly decreased to 6.99%, potentially encouraging more buyers to explore their options.

    Throughout July 2024, the market showed more notable changes. During the week of July 8 to July 15, new listings slightly dropped to 1,159, with 148 price adjustments. This week had one of the lowest pending ratios in the dataset, with a pending sales count of 2,201, reflecting a slower pace in the market. The mortgage rate for this period was 6.89%, which might have influenced buyer activity.

    One of the highest ratios recorded was from August 19 to August 26, where the pending ratio reached 0.87. During this time, 910 new listings were recorded, with 227 properties undergoing price changes, and a high pending sales count of 1,692. This week stood out as a period of intensified market activity, with a relatively lower mortgage rate of 6.49%. Additionally, there were 2,908 open houses during this time, suggesting a strong level of buyer interest in viewing properties.

    As we look closer at the fall season, the trend shows some slowing in both new listings and pending ratios. For example, from September 30 to October 7, the pending ratio was 0.76, with 1,016 new listings and 193 price changes. The pending sales count was 1,575, and the mortgage rate slightly rose to 6.95%, which may have influenced a more cautious buyer market.

    Most recently, during the week of October 21 to October 28, new listings dropped to 749, marking one of the lowest counts in recent months. The pending ratio was 0.79, with a pending sales count of 1,420. With the mortgage rate at 6.54%, we may see additional adjustments in buyer behavior moving forward.

    Overall, this data reveals the trends in the residential real estate market over recent months. From changes in new listings and price adjustments to shifts in mortgage rates and pending ratios, this report captures the dynamic nature of the housing market. Each week brings unique fluctuations, providing valuable insights for those watching market trends or considering entering the real estate market.

    • real estate market
    • residential listings
    • weekly update
    • mortgage rates
    • pending sales
    • Real estate trends
    • housing market 2024
    • home listings analysis
    • open houses
    • market activity
    • residential trends
    • price changes
    • back on market rate
    • real estate data analysis
    • property market

    Related Articles

    Keep reading other bits of knowledge from our team.

      Request Info

      Have a question about this article or want to learn more?