What's Happening in Downtown Austin? A Look Inside the 78701 Housing Market
Downtown Austin is telling a story the rest of the city hasn't caught up to yet. In the 78701 zip code, median sold prices have fallen 19.6% from their 2023 peak, active listings sit near multi-decade highs, and more than half of everything currently for sale has already taken a price cut. If the broader Austin real estate market is soft, downtown is something else entirely — a concentrated correction playing out in the most expensive square mile in the city. This isn't a short-term wobble. It's a structural shift with 21 years of context behind it, and the data from April 22, 2026 makes the picture unusually clear.
The Headline: Prices Are Down 19.6% from Peak
In 2023, the 78701 zip code posted its all-time peak median sold price of $718,750. Through the first portion of 2026, the median sold price sits at $577,798 — a decline of $140,952, or 19.6%, from that peak. The average sold price has moved from a peak of $1,094,476 in 2023 to $871,004 year to date, a drop of roughly 20.4%.
It's worth noting the 2026 figures reflect a relatively small sample of 68 closed transactions year to date, so the number will continue to move as more deals close. Even accounting for that, the direction is unmistakable. Looking at the rolling 12-month trailing median, 78701 has swung from $1,100,000 as recently as January 2026 down to $537,000 in April 2026 — a 51% drop across the trailing-median series in just three months, driven by a shift in the mix of properties selling and a clear softening of demand at the upper end.
For context, the 78701 zip code has delivered a 25-year annual compound growth rate of 5.39%, climbing from a median of $175,000 in 2001 to its 2023 peak. The current pullback doesn't erase that long arc, but it does mark the deepest correction downtown has experienced since the post-2007 period.
Inventory Tells the Real Story
On April 22, 2026, there are 249 active residential listings in 78701 against just 30 pending sales. That yields an Activity Index of 10.8%, which is a clear reading of a cold market. The Activity Index measures pending sales as a share of pending plus active listings — the higher the number, the more of the market is moving. At 10.8%, only a small fraction of downtown inventory is finding a buyer at any given moment.
Months of Inventory stands at 11.67. Using Team Price Real Estate's market classification, anything below 5 months is a seller's market, 5 to 7 months is neutral, and above 7 months is a buyer's market. At nearly 12 months, downtown Austin is deep into buyer's market territory — and it's been there for most of the past two years.
The pricing behavior of sellers confirms what the inventory is already saying. Of the 249 active listings, 145 — or 58.2% — have already reduced their list price. Another 101 listings (40.6%) have held their original price, and just one listing has raised it. The average price drop is 7.8%, and the median drop is 6.3%. The average list price on the board sits at $1,173,724, with a median of $800,000. Days on market average 111, with a median of 62.
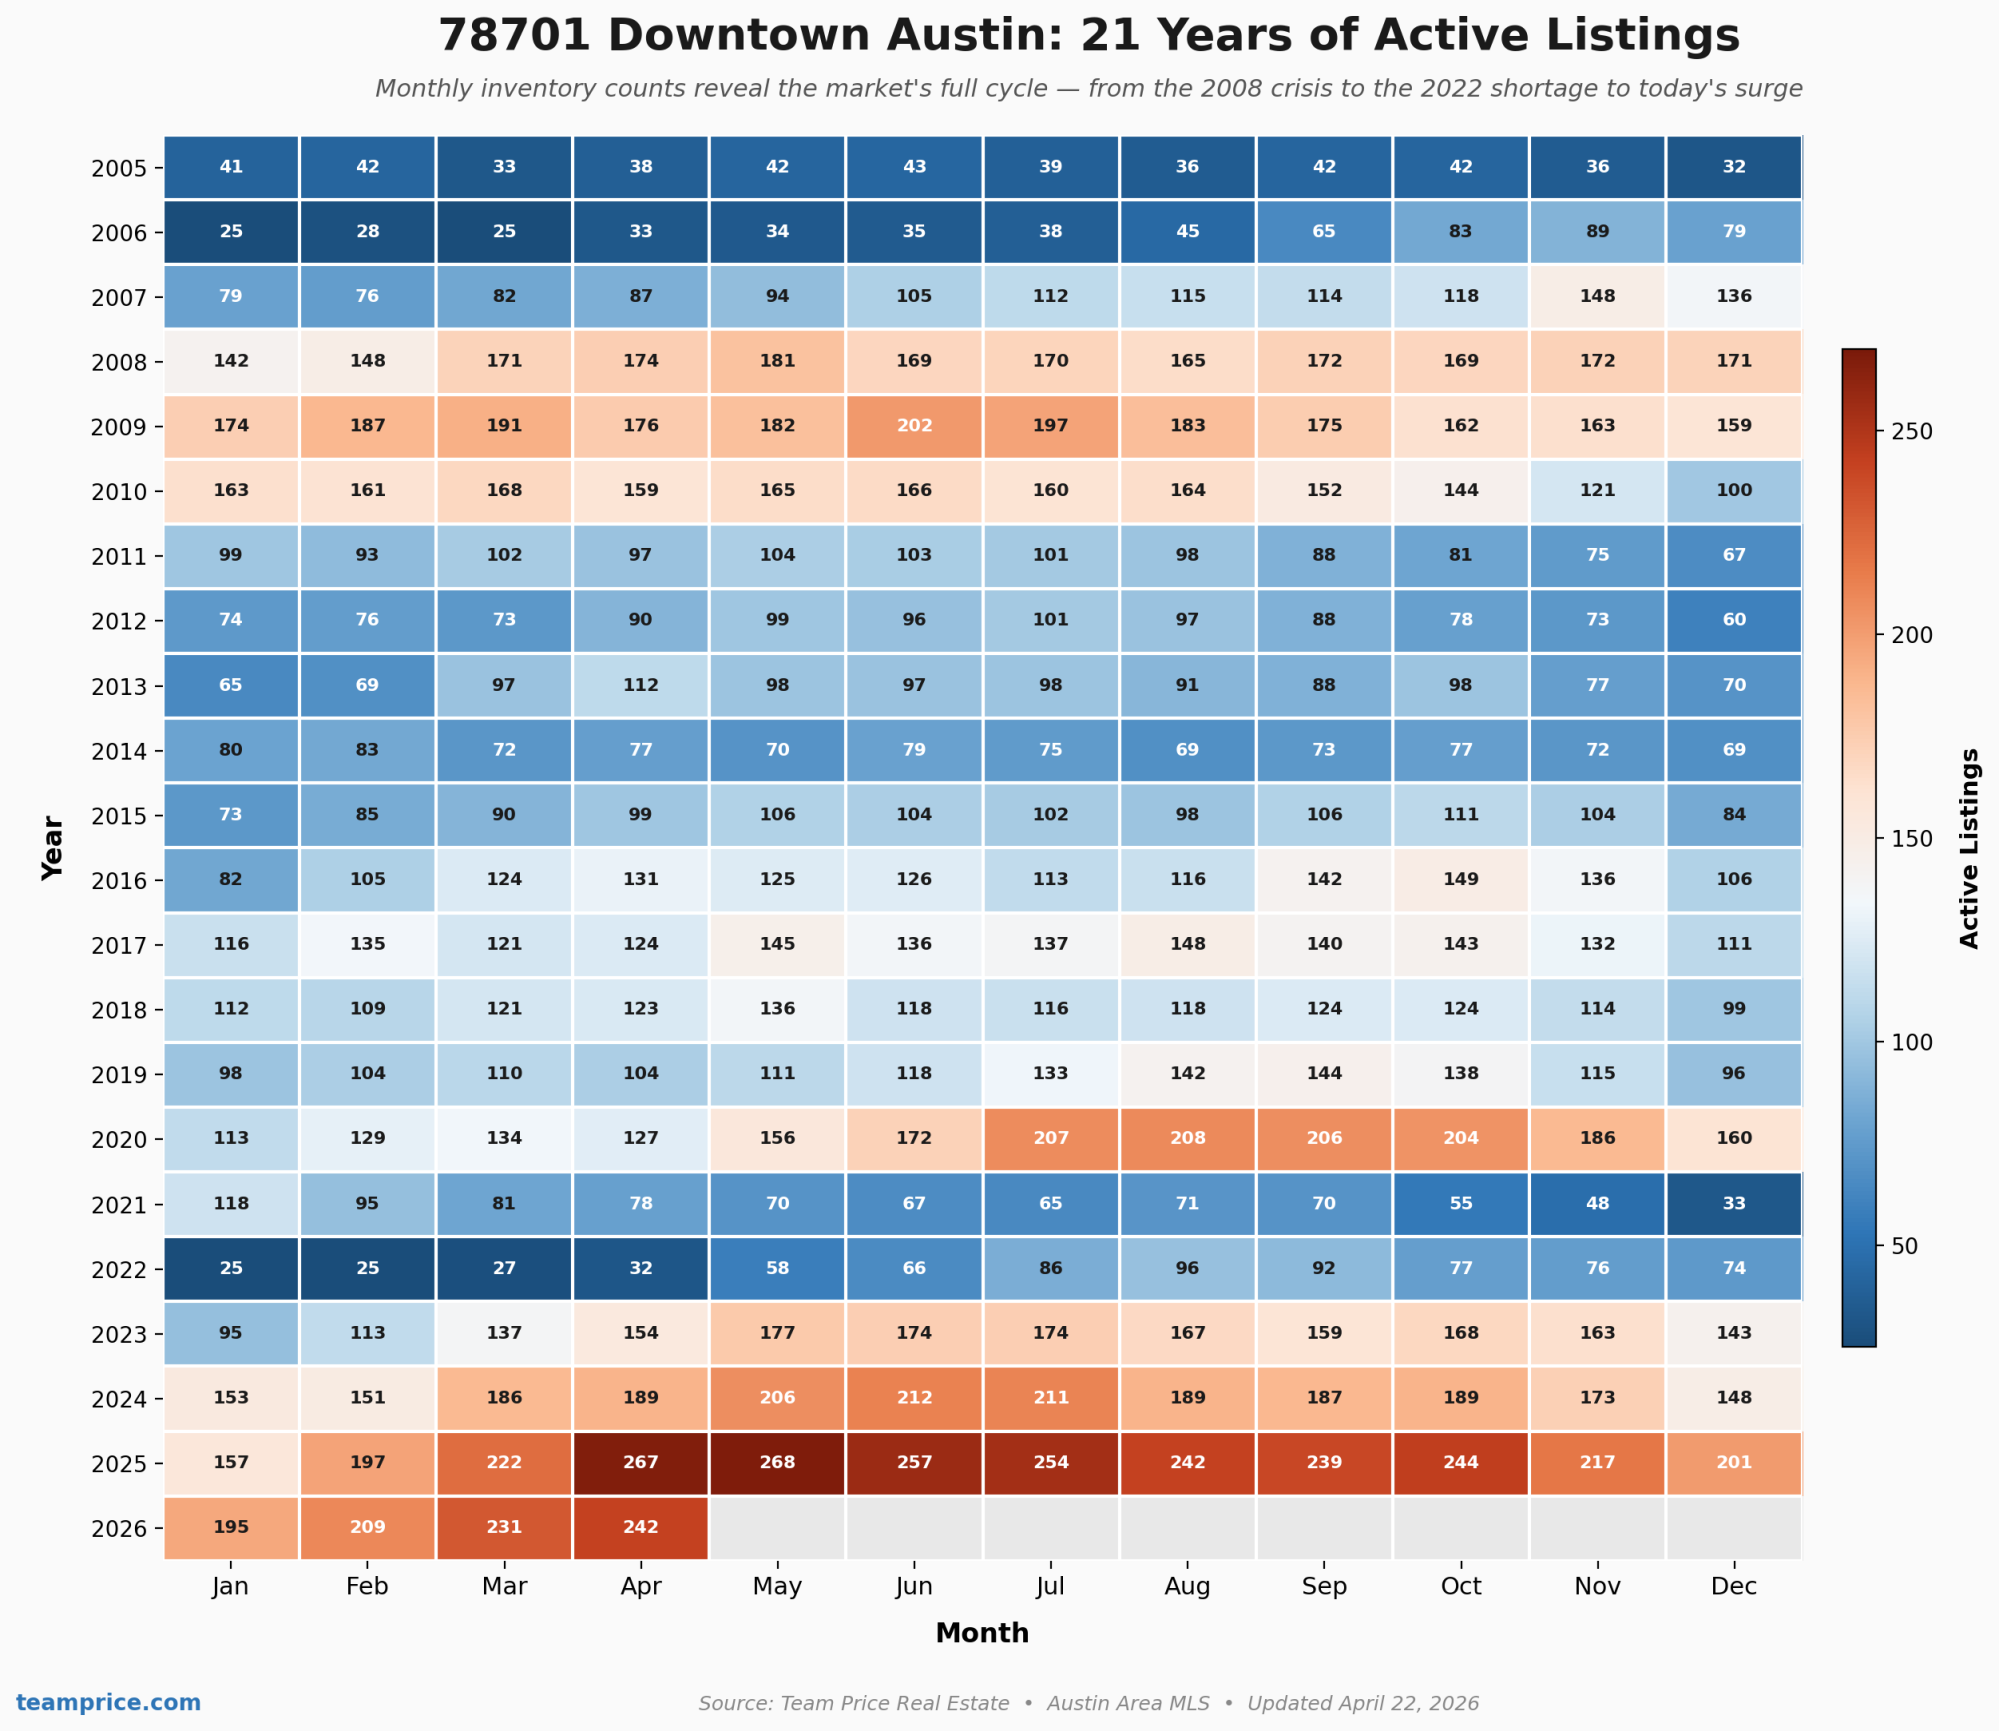
A 21-Year View of Downtown Inventory
The heatmap above is the clearest way to understand how extreme the current environment really is. Each cell represents a single month's active listing count going back to 2005. The dark blue periods — 2005, 2006, 2014, 2021, and especially the first half of 2022 — show the moments when downtown inventory was scarce and sellers held the leverage. The orange and red zones show the opposite: 2008 through 2010 during the global financial crisis, and now 2024 through 2026.
April 2022 had just 32 active listings in 78701. April 2026 has 242. That's a 656% increase in available inventory in exactly four years. The pandemic-era shortage wasn't just historically tight — it was the tightest the downtown market had been in at least 21 years, and possibly ever. What looked like a permanent new normal in 2021 reversed harder and faster than almost anyone predicted.
There is, however, a subtle sign the inventory surge may be topping out. April 2026's 242 active listings are actually down from April 2025's 267 — the first April-over-April decline since 2022. It's a small move, and one month doesn't make a trend, but it's the first data point suggesting the relentless climb in downtown listings may be leveling off.
Who's Selling and What's Sitting
The composition of 78701's active inventory adds another layer. Of the 249 active listings, 89.56% are resale properties and 10.44% are new construction. On the occupancy side, 46.18% of active listings are vacant, 30.92% are owner-occupied, and 22.89% are tenant-occupied. That high vacancy rate is consistent with a condo-heavy downtown market where many units are second homes, short-term rental conversions, or investor holdings — categories that behave differently from primary residences when carrying costs rise and appreciation stalls.
The combination of high vacancy, elevated days on market, widespread price cuts, and a nearly 12-month inventory overhang points to a market where sellers are increasingly motivated but buyers are in no hurry. With the Activity Index at 10.8%, that dynamic favors well-positioned buyers with the patience to negotiate and the conviction to move when the right property surfaces.
What It Means for the Broader Austin Housing Market
Downtown Austin has historically led the metro in both directions. It overheated first in 2021 and 2022, and it's now correcting first and hardest. The 78701 zip code is not representative of the entire Austin real estate market — it's a specialized, condo-dominant sub-market with its own supply dynamics — but it's often a leading indicator of how the luxury and investor-driven segments of the broader market are behaving.
The Austin housing market as a whole has been working through elevated inventory, affordability pressure from mortgage rates, and a post-pandemic reset in buyer expectations. Downtown shows what that process looks like when it's concentrated: steep price discovery, heavy seller concessions, and a buyer pool that can afford to be selective. For the rest of the Austin real estate market, 78701's behavior through 2026 will be worth watching closely.
Frequently Asked Questions
Is now a good time to buy a condo in downtown Austin?
For buyers with strong financial footing and a long time horizon, the current downtown Austin condo market offers more leverage than it has in years. With 58.2% of active listings already reduced, an Activity Index of just 10.8%, and 11.67 months of inventory, buyers can negotiate harder than at any time since 2010. Median sold prices in the 78701 zip code are down 19.6% from their 2023 peak. That said, a market this cold can stay cold, so buyers should expect continued negotiating power rather than rapid appreciation in the near term.
How does the 78701 zip code compare to the broader Austin housing market?
The 78701 zip code is behaving more bearishly than the overall Austin real estate market. Downtown Austin's condo-heavy inventory, high vacancy rate (46.18% of active listings), and concentration of investor and second-home owners make it more sensitive to interest rates and carrying costs. While the Austin housing market overall is working through elevated inventory and slower appreciation, downtown is experiencing a deeper correction with steeper price cuts and longer days on market.
What is the Activity Index and why does 10.8% matter?
The Activity Index measures pending home sales as a share of total pending plus active listings. It's a forward-looking gauge of market momentum — higher numbers mean a larger share of inventory is finding contracts. A reading of 10.8% in downtown Austin means only about one in ten listings is under contract at any given moment. Healthy, balanced markets typically read in the 20% to 30% range, and hot seller's markets read above 40%. At 10.8%, 78701 is firmly in cold, buyer-favoring territory.
How much have home prices dropped in Austin's 78701 zip code?
The median sold price in the 78701 zip code has declined from a 2023 peak of $718,750 to $577,798 year to date in 2026, a drop of 19.6%. Average sold prices have fallen from $1,094,476 in 2023 to $871,004, a decline of approximately 20.4%. These figures reflect year-to-date 2026 data based on a smaller sample of closed sales, so they will refine as the year progresses. The longer-term picture remains positive — 78701 has averaged 5.39% annual compound growth over the past 25 years — but the current cycle represents the deepest downtown correction since the post-2007 era.
Is downtown Austin inventory still rising?
Not quite. April 2026's 242 active listings in 78701 are actually below April 2025's 267 — the first April-over-April decline in downtown inventory since 2022. That's a subtle but meaningful shift. It doesn't mean inventory is falling broadly, but it does suggest the steep ramp-up from the 2022 low of 32 active listings may be plateauing. Combined with 58.2% of current listings already reducing price, the market is showing early signs of sellers either finding clearing prices or pulling back from listing. Whether that stabilizes into a floor or just a pause will depend on rates, buyer sentiment, and how motivated the sidelined sellers remain.