Weekly Austin Real Estate Market Update
Austin Real Estate Weekly Market Update - July 10, 2025
by: Dan Price, Broker at Team Price Real Estate
Austin's leading data analysis brokerage, where data drives exceptional service
Published on: Thursday, July 10, 2025 at 10:44 am
Austin’s Real Estate Market: A Transition in Full View
Austin’s housing market continues its steady evolution as inventory levels climb and buyer behavior adapts to a landscape with more supply and fewer bidding pressures. According to the latest figures from Team Price Real Estate, active residential listings across the Austin-Area MLS now stand at 17,713—up 9.8% compared to this time last year. Months of Inventory has increased to 6.09, a 10.8% year-over-year gain. These changes signal a market that has clearly moved away from its ultra-competitive past and is now offering buyers more options and leverage across most price ranges.
Pricing trends reinforce the impact of this elevated supply. The median sold price for the Austin-Area MLS is currently $425,000, a 3.2% decline from last year, while the average sold price is up just 0.8%, reaching $570,434. This continued gap between average and median pricing reflects a market where strength at the high end is supporting average price metrics, but broader affordability challenges are putting downward pressure on the middle tiers.
Within the City of Austin, the shift is even more evident. Inventory has risen 13.7%, with 5,680 active listings now on the market. Months of Inventory has grown to 6.73—an increase of 13.2%—placing additional downward pressure on pricing for many homes, particularly those in the $550,000 to $650,000 range. The median sold price in the city has dropped to $583,000, down 2.2% year over year, while the average sold price remains nearly flat at $777,658, a slight 0.1% decrease. While luxury listings continue to draw interest, the broader market is clearly adjusting as buyers weigh higher mortgage costs against a growing pool of options.
This is no longer the Austin of 2021, where multiple offers within 24 hours were the norm. Today’s market favors thoughtful decision-making, deliberate negotiation, and data-backed pricing strategies. Buyers now benefit from improved selection, longer timeframes, and reduced competition. Sellers must price precisely, stage effectively, and understand the reality of longer days on market and increased price sensitivity.
Whether you're considering buying, selling, or investing, the key to navigating this evolving landscape lies in understanding the specific trends shaping your target neighborhood and price range. For the latest hyperlocal insights broken down by city, zip code, and price tier, scroll down to download our most recent comprehensive market report—packed with actionable data and expert analysis for the entire Austin region.

Austin Real Estate Market Overview
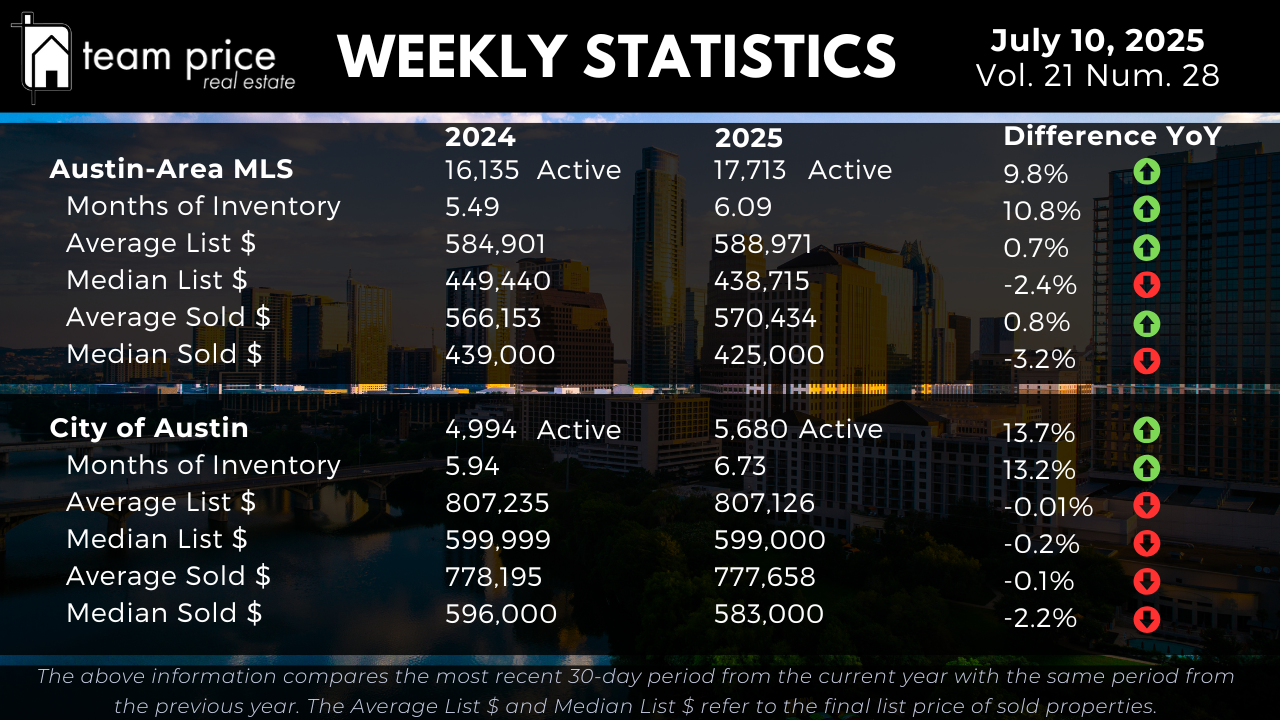
Inventory levels across the Austin-Area MLS continue to climb steadily, reinforcing that the region remains in a prolonged transition phase. As of this week, there are 17,713 active residential listings, representing a 9.8% year-over-year increase. Months of Inventory has expanded to 6.09, up from 5.49 a year ago—a 10.8% gain that reflects a market where supply is growing faster than demand. Within the City of Austin, this trend is even more pronounced. Active listings are up 13.7%, now at 5,680 homes, while Months of Inventory has risen to 6.73 from 5.94 last year—an increase of 13.2%. The continued growth in available homes gives buyers more leverage, greater negotiating power, and an increasing ability to wait for the right opportunity.
Austin Housing Prices: Stability with Pockets of Softness
The latest pricing data illustrates a market attempting to balance between softening demand and seller expectations. Across the Austin-Area MLS, the average list price of active homes is $588,971—up just 0.70% year over year—while the median list price has dropped by 2.39% to $438,715. On the sales side, the average sold price has nudged up 0.8% from last year to $570,434, while the median sold price declined 3.2% to $425,000. These figures indicate that while higher-end sales are helping stabilize average prices, affordability concerns and greater competition are compressing the mid-tier and entry-level segments.
Within the City of Austin, pricing trends reflect even more stagnation. The average list price has held flat year over year at $807,126, showing virtually no movement. The median list price dipped marginally by 0.2% to $599,000. Meanwhile, the average sold price decreased slightly by 0.1% to $777,658, and the median sold price declined 2.2% to $583,000. The data suggests that sellers, particularly those in the $550,000 to $650,000 range, must now compete more aggressively as pricing continues to drift and buyers remain cautious in response to rate sensitivity and expanded choices.
Regional Trends: Correction Persists Across Central Texas
Conditions across the broader Central Texas region continue to reflect a market correction rather than recovery. Among the 30 cities monitored, just 33% (10 cities) posted month-over-month price increases, while 60% saw declines. Year over year, only 10 out of 30 cities have experienced price gains—just 33%—while the remaining 67% have declined. Notably, none of these cities have surpassed their price peak from the past 12 months, reinforcing that while some localized momentum exists, the region remains in an extended correction cycle.
The ZIP code data mirrors this broader trend. Of the 75 ZIP codes tracked, 48% showed month-over-month price gains, while 48% recorded declines—indicating a near-even split with no clear directional trend. On a year-over-year basis, 36 ZIP codes have posted price increases (48%), while 39 have declined (52%). Only 4 ZIP codes are currently above their 12-month pricing peaks, a clear sign that most submarkets remain in a rebalancing phase, with few having fully recovered to prior highs.
List-to-Sale Price Performance: Negotiation Remains the Norm
The prevalence of price negotiation continues to define this market cycle. So far this month, 67.74% of all sold homes in the Austin-Area MLS have closed below their original list price—up from 65.92% the previous month. An additional 21.24% of sales closed exactly at asking price, while only 11.02% sold above list, down from 12.25% in June and 13.22% in July of last year. The average sold-to-list price ratio currently sits at 97.27%, confirming that modest seller concessions are now routine. This data underscores the importance of precision pricing and strong presentation, especially as buyers are growing more strategic and inventory continues to build.
Peak Value Trends: Market Remains Well Below Previous Highs
While recent pricing has shown relative steadiness, the broader market remains significantly below its prior peaks. In the Austin-Area MLS, the average list price reached a high of $714,434 in April 2025 and has since declined to $635,914—a drop of 10.9%. The median list price peaked at $539,900 in May 2022 and is now down 14.9% to $459,000. The average sold price has fallen 10.6% from its May 2022 high of $664,515 to $594,371, while the median sold price is down 18.2%, from $538,000 to $440,000. Price per square foot trends show similar declines: the average dropped 19.1% from $324 to $262, and the median fell 23.2% from $280 to $215.
The City of Austin follows this same trend. The average list price hit $948,840 in April 2025 and now stands at $840,651, down 11.4%. The median list price is down 11.3%, from $659,500 to $585,000. The average sold price has declined 8.1% from its peak of $847,583 to $779,230, while the median sold price has dropped 17.3% from $680,000 to $562,500. The average price per square foot has decreased by 21.9%, from $442 to $345, and the median has fallen 21.9%, from $393 to $307. These metrics confirm that although the market is showing signs of finding balance, it remains well below its peak values—underscoring the extended nature of the correction and the need for informed decision-making in today’s environment.
Austin Area Residential Sales Insights
Top Questions, Top Answers
1. Is the Austin housing market still in a correction phase in 2025?
Yes, the Austin housing market remains in a prolonged correction. Although inventory levels and pricing appear to be stabilizing in some submarkets, the broader regional data confirms that the market has not recovered to its previous highs. For example, the median sold price in the Austin-Area MLS is currently $425,000, down 3.2% year over year and nearly 18.2% below its peak of $538,000 in May 2022. Similarly, only 4 out of 75 ZIP codes across Central Texas are above their 12-month price peak. This widespread underperformance—especially in mid-range price tiers—reinforces that the region remains in a correction cycle, shaped by affordability constraints, higher mortgage rates, and a growing inventory of listings.
2. Are home prices in Austin going up or down in 2025?
Home prices in Austin are generally flat to declining in 2025. In the City of Austin, the average sold price has dropped slightly by 0.1% year over year, now sitting at $777,658, while the median sold price fell by 2.2% to $583,000. Across the broader Austin-Area MLS, the average sold price is up just 0.8%, but the median sold price has declined by 3.2%, indicating that high-end sales are propping up averages even as the middle of the market softens. Sellers in the $500K–$700K range are facing the most pricing pressure due to rising inventory and affordability constraints among buyers.
3. How much negotiating room do buyers currently have in Austin?
Buyers in today’s market are seeing increased negotiating power. As of this month, 67.74% of homes sold across the Austin-Area MLS closed below their original list price, up from 65.92% last month. Only 11.02% of homes sold above list, down from 13.22% in July 2024. The average sold-to-list price ratio is now 97.27%, indicating that most sellers are conceding roughly 2.7% off the original price. With inventory at 6.09 months of supply (up from 5.49 last year), buyers are less likely to face bidding wars and more likely to secure concessions or incentives.
4. How does today’s inventory compare to last year in Austin?
Inventory is significantly higher than last year. The Austin-Area MLS has 17,713 active listings, compared to 16,135 in 2024, marking a 9.8% increase in supply. Months of Inventory—a key indicator of market balance—has risen from 5.49 to 6.09, a 10.8% increase, reflecting slower absorption due to softening demand. In the City of Austin, inventory has climbed even more sharply—up 13.7% year over year, with Months of Inventory now at 6.73. This expanded supply landscape gives buyers more choices and extends time on market, putting additional pressure on sellers to price competitively.
5. Are any areas in Central Texas seeing price recovery or growth in 2025?
Only a limited number of areas are showing signs of monthly improvement, and even fewer have seen any recovery to prior peak values. Among the 30 cities tracked, only 10 (33%) posted year-over-year price increases, while 20 cities (67%) saw declines. None of the cities have returned to their peak pricing from the past 12 months. At the ZIP code level, 48% of the 75 ZIP codes saw year-over-year price growth, but 71 ZIP codes remain below their 12-month peak. While a few pockets may experience short-term gains, the overwhelming trend across the region still points to a gradual, drawn-out correction.
Latest Articles
- All Articles
- real estate market
- Austin housing market
- property analysis
- Austin real estate
- property market analysis
- real estate trends