Austin Real Estate Weekly Market Update – October 23, 2025
by: Dan Price, Broker at Team Price Real Estate
Austin's leading data analysis brokerage, where data drives exceptional service
Published on: Thursday, October 23, 2025 at 5:40 am
The Austin housing market is steadily transitioning toward a more supply-driven environment as fall progresses, with inventory continuing to build and buyer activity moderating. Homes are remaining on the market longer, pricing is flattening or softening in key segments, and negotiation leverage is shifting toward buyers. While the market remains technically balanced, momentum is clearly moving in favor of buyers as we enter the final quarter of 2025, signaling a continued normalization phase rather than a short-term fluctuation.
Scroll down to view the full Austin Real Estate Market Statistics PDF for October 23, 2025.
Inventory Expansion and Market Rebalancing
The Austin housing market is continuing its rebalancing phase as inventory expands and buyer absorption slows relative to new listing activity. Across the Austin-Area MLS, the number of active residential listings has increased 14.8% year over year, rising from 14,238 homes to 16,348. This increase in available inventory has pushed Months of Inventory from 5.28 to 5.86, an 11.1% gain, indicating that homes are taking longer to sell and buyers have more options at their disposal. Inside the City of Austin, the trend remains consistent though slightly less aggressive, with active listings up 8.0% from 4,643 to 5,014 and Months of Inventory rising from 5.52 to 5.87. While the market remains technically balanced, the clear directional shift toward elevated supply confirms that Austin is firmly in a buyer-leveraged phase as the fourth quarter progresses.
Pricing Trends and Market Direction
Price movement across the region is subtle but directionally meaningful. In the Austin-Area MLS, the average list price increased 3.6% year over year to $594,206, while the median list price declined 1.0% to $429,990, indicating that upper-tier properties are helping support averages while mid-tier pricing trends reflect affordability pressure. Sold data follows the same pattern. The average sold price rose 3.6% to $571,391, while the median sold price slipped 1.4% to $416,000. Inside the City of Austin, pricing corrections are more evident. The average active price increased slightly by 1.1%, but the median list price declined 2.2% from $590,000 to $577,000, and the median sold price fell 2.9% from $575,000 to $558,500. These figures confirm that while higher-end demand remains intact, the broader market is experiencing measured downward pressure as buyers assert greater control over price negotiations.
Negotiation Environment and Buyer Leverage
Negotiation dynamics further illustrate the shift in market power. Nearly seven out of ten homes are now selling below list price, with 69.21% of closed sales this month transacting under asking. Only 18.40% of homes are selling at list price, and 12.38% are commanding prices above list. The average sold-to-list price ratio has moved to 96.95%, confirming that sellers are conceding approximately three percent from their original asking prices, with deeper discounts occurring in segments where inventory levels are highest or where properties have experienced extended days on market. This is a materially different environment from the peak activity years of 2021 and 2022 and underscores the importance of pricing precision and strategic adjustments.
Regional and ZIP Code Performance
Market conditions are no longer uniform and are now heavily influenced by hyperlocal factors. Among the 30 tracked cities in Central Texas, only 37 percent reported month-over-month price increases while 63 percent saw declines. Year over year, 30 percent of cities posted price gains and 70 percent experienced declines, with all 30 cities currently trading below their 12-month peak. At the ZIP code level, performance is more evenly split. Fifty-one percent of ZIP codes experienced month-over-month price increases, while 48 percent saw declines. Year-over-year trends reveal 47 percent of ZIP codes with price gains compared to 53 percent with declines. Only one ZIP code in the region remains above its 12-month peak, confirming that price normalization is consistent across the market.
Prices Relative to Peak Levels
When compared to peak market conditions, current pricing confirms a completed correction and a transition toward equilibrium. Across the Austin-Area MLS, the average sold price is down just over ten percent from its May 2022 high, while the median sold price is down 19.1 percent. In the City of Austin, the median sold price has declined 17.6 percent from peak levels. On a price-per-square-foot basis—a more accurate indicator of true market movement—both the MLS and the City of Austin are trading between twenty and twenty-five percent below their highs. These declines illustrate the full normalization of the market following the pandemic-era surge, while also highlighting that the market has now found a new floor and is holding stable year to date.
Market Outlook
As we advance through the final quarter of 2025, the Austin housing market is defined by elevated supply, slower absorption, and increased pricing flexibility. Buyers are benefiting from expanded inventory and improved negotiating position, while sellers who price according to current conditions are still finding success. Although year-over-year pricing is slightly negative in median values, the stability in average prices demonstrates continued demand in higher price brackets alongside more conservative activity in entry and mid-tier segments. This is not a distressed market. Rather, it is a mature, data-driven environment where opportunity exists for those who respond strategically. Inventory is building, leverage is shifting, and long-term fundamentals remain intact, positioning Austin for renewed appreciation once rates stabilize and demand cycles reset.
Austin Housing TOP Questions and Answers
What is the latest update on the Austin housing market?
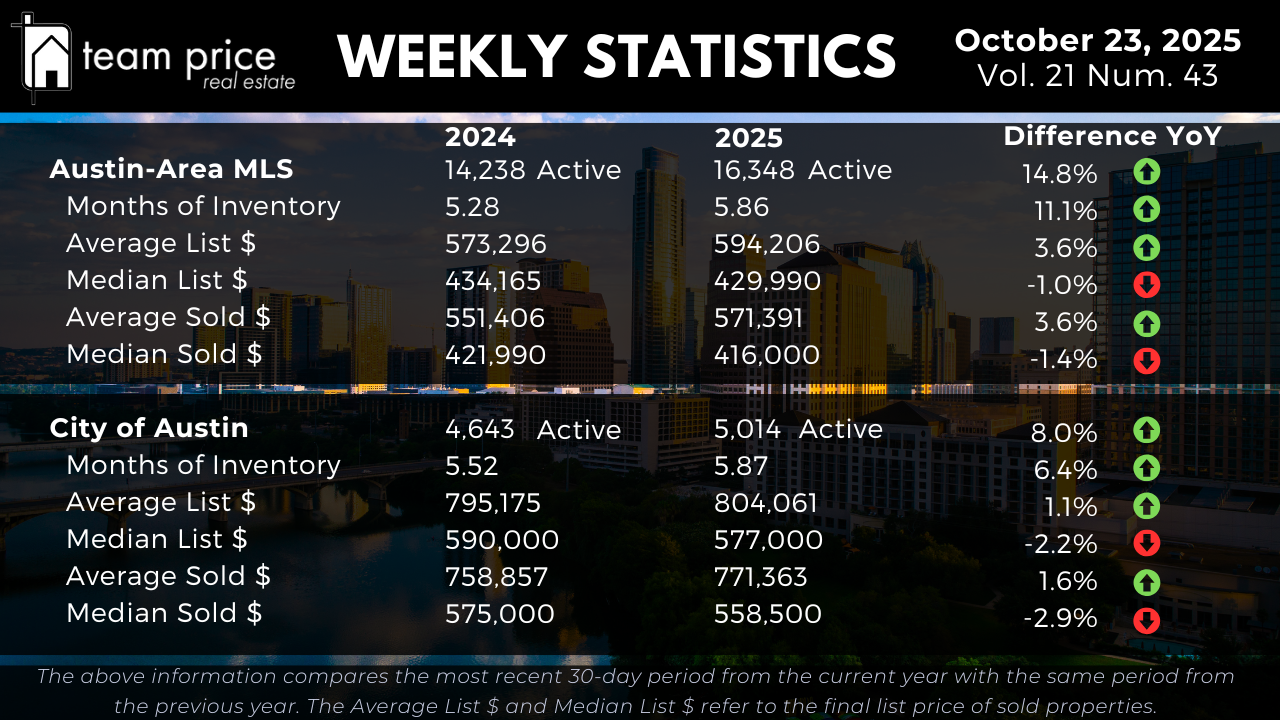
The Austin housing market is in a clear phase of rebalancing as inventory continues to rise and buyer absorption slows. Active listings across the Austin-Area MLS have increased 14.8% year over year, from 14,238 to 16,348, while Months of Inventory has climbed from 5.28 to 5.86—a rise of 11.1%. Within the City of Austin, inventory has grown 8.0%, and Months of Inventory has increased from 5.52 to 5.87. This expansion in supply confirms that homes are taking longer to sell, and the market is transitioning toward a more buyer-favorable environment.
Are home prices in Austin dropping?
Median prices are experiencing moderate declines year over year, indicating downward movement in typical buyer segments. Across the Austin-Area MLS, the median sold price declined 1.4%, from $421,990 to $416,000. In the City of Austin, the median sold price fell 2.9%, from $575,000 to $558,500. Median list prices are also down, with the Austin-Area MLS recording a 1.0% decrease and the City of Austin showing a 2.2% decline. While average prices are slightly up due to higher-end transactions, the median figures reflect softening in the core market.
What is the real estate market in Austin in 2025?
The 2025 market is defined by increased inventory, slower absorption, and pricing that is stable at the average level but declining at the median level. Active listings are up across both the metro and the city, and Months of Inventory has risen, indicating reduced urgency among buyers. The average sold price in the Austin-Area MLS is up 3.6%, but the median sold price is down 1.4%, showing a shift toward affordability and negotiation-driven transactions. The market is no longer in a rapid growth phase but is operating in a state of normalization.
Is Austin's boom over?
Based solely on the data, the boom phase has concluded, and the market is now in a post-peak normalization cycle. From their 12-month peak, all 30 tracked cities and 74 of 75 ZIP codes have seen prices decline. Months of Inventory has increased across the metro and the city, signaling a transition from rapid expansion to a balanced or supply-heavy market environment. Prices are no longer accelerating; instead, they have settled into a stable but softened range compared to peak conditions.
Is it better to buy a house now or wait until 2025?
Based strictly on current conditions, 2025 is already underway, and the data reflects that buyers currently have increased leverage. With 69.21% of homes selling below list price and the average sold-to-list ratio at 96.95%, buyers are negotiating meaningful discounts. Inventory is at its highest level in recent years, and most ZIP codes are trading below their peak values. The current environment favors buyers more than sellers, indicating that conditions are advantageous now rather than improving later.
Is Austin a buyers or sellers market?
Austin is trending firmly toward a buyer’s market. Months of Inventory across the Austin-Area MLS has risen to 5.86 months, and in the City of Austin it is now 5.87 months—both above the traditional threshold of five months that marks the beginning of buyer-favorable conditions. Additionally, nearly seven out of ten homes are selling under list price, while only 12.38% are selling above list. These figures indicate that buyers have leverage in negotiations, and sellers must compete more aggressively on price.