Is Austin real estate inventory still rising in 2026?
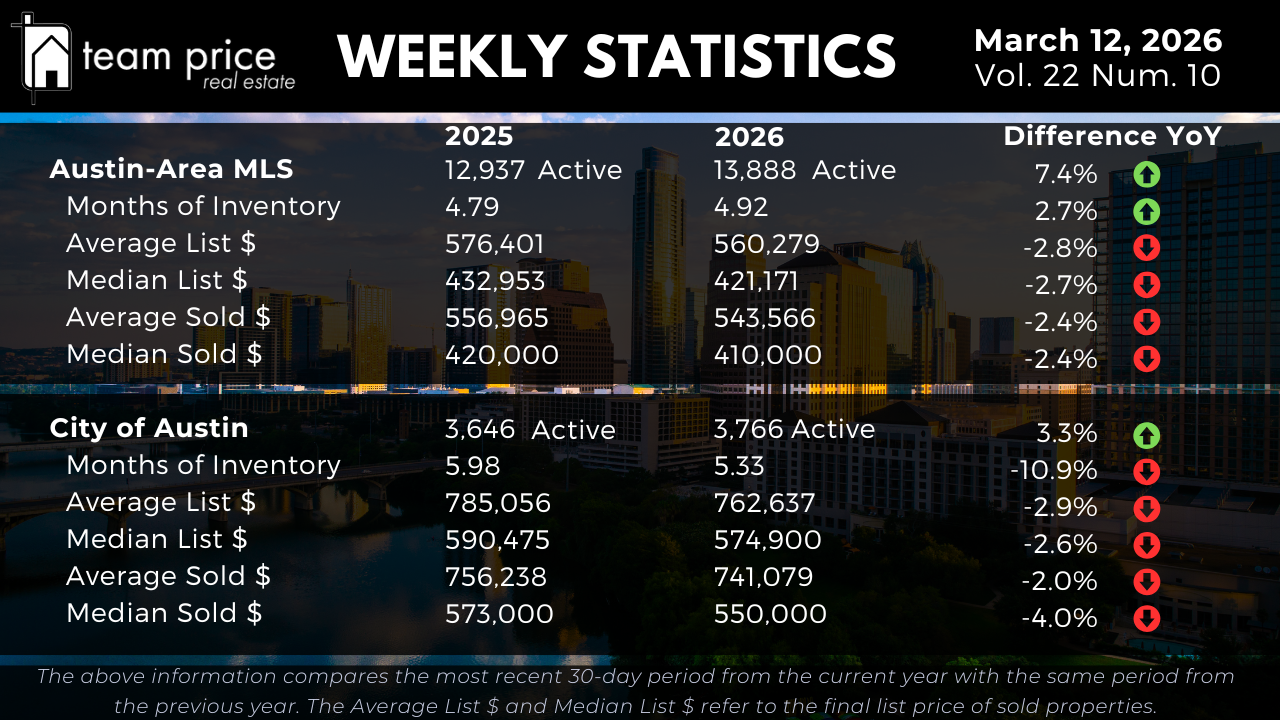
Active listings across the Austin-Area MLS grew from 12,937 to 13,888 year over year, a 7.4% increase that reflects continued supply expansion heading into the spring buying season. At the current pace of sales, Months of Inventory stands at 4.92 months, up from 4.79 months a year ago. Anything above 6 months is traditionally considered a buyer's market; at 4.92, the Greater Austin MLS sits in a moderate zone where buyers have leverage but well-priced homes are still moving.
The City of Austin is bucking that trend. While active listings in the city proper rose from 3,646 to 3,766, a 3.3% year-over-year gain, Months of Inventory actually fell from 5.98 to 5.33 — a 10.9% decline. Demand within Austin's city limits is absorbing supply faster than the surrounding metro, a divergence that matters for anyone buying or selling specifically inside the city.
What are Austin home prices doing right now?
Austin home prices are lower than a year ago across every tracked metric. The average active list price declined from $576,401 to $560,279, down 2.8% year over year. The median active list price fell from $432,953 to $421,171, a 2.7% drop. Nearly half of all active MLS listings — 47.5% — have seen at least one price reduction, reflecting how broadly sellers are recalibrating across the metro.
On the sold side, the average sold price dropped from $556,965 to $543,566, a 2.4% year-over-year decline, and the median sold price fell from $420,000 to $410,000, also down 2.4%. Buyers who closed in March 2026 paid measurably less than buyers who closed in March 2025 across the full price range.
How are City of Austin home prices trending?
The City of Austin is softening more sharply than the broader metro on the sold side. The average active list price eased from $785,056 to $762,637, down 2.9%, and the median active list price slipped from $590,475 to $574,900, a 2.6% decline. Those figures track closely with the metro. The closed-sale data is where Austin proper separates.
The average sold price in the City of Austin declined from $756,238 to $741,079, a 2.0% year-over-year decrease. The median sold price fell from $573,000 to $550,000 — a 4.0% drop and the steepest year-over-year decline of any metric tracked this week across either geography. That is a $23,000 reduction in what the typical buyer paid for a home inside Austin's city limits compared to the same period last year.
Who has the upper hand right now — buyers or sellers?
Buyers still hold the advantage on balance, but that advantage is narrowing. The average sold-to-list price ratio is 97.50%, meaning the typical Travis County home sold for 2.5% below its final list price. The more telling signal is the directional shift happening inside that number.
Homes selling under list price dropped from 68.15% last month to 64.93% this month. Homes selling over list price climbed from 10.98% last month to 15.22% — higher than the 13.11% recorded in March 2025. The share selling at list price was 19.85%, down slightly from 20.88%. Overpriced listings are still sitting. But accurately priced homes in desirable areas are drawing multiple offers. Buyers who assume every seller is negotiating from desperation may find themselves losing to better-prepared competition.
How are prices moving across Austin-area cities and ZIP codes?
Across the 30 cities tracked in Central Texas, 19 of 30 — 63% — showed a month-over-month price increase this week, while 10 of 30, or 33%, declined. Monthly momentum is tilted positive. Year-over-year, the market is split exactly down the middle: 15 cities up, 15 down. Against 12-month peaks, 27 of 30 cities are still trading below their highs.
The 75 ZIP codes tell a more cautious story. Month-over-month, 37 of 75 ZIP codes posted a price increase while 35 declined — a near-even split. Year-over-year, only 29 of 75 ZIP codes are up, while 46, or 61%, are trading lower than this time last year. Against their 12-month peaks, 71 of 75 ZIP codes remain below their high-water marks. Just 4 ZIP codes are at or above peak pricing.
How far have Austin home prices fallen from their peak?
Austin-Area MLS prices remain well below their pandemic-era highs. The average list price peaked at $708,929 in March 2023 and currently sits at $689,184, down $19,745 or 2.8%. The median list price peaked at $539,900 in May 2022 and is currently $450,000, a decline of $89,900 or 16.7%.
On the sold side, the average sold price peaked at $664,515 in May 2022 and now stands at $569,956, a drop of $94,559 or 14.2%. The median sold price peaked at $538,000 and is currently $440,945, down $97,055 or 18.0%. Price per square foot has seen similar erosion: the average sold price per square foot peaked at $324 in April 2022 and is currently $251, down 22.5%, while the median peaked at $280 and now stands at $213, down 23.9%.
In the City of Austin, the average list price peaked at $958,749 in September 2025 — a far more recent high — and currently sits at $883,228, off $75,521 or 7.9%. The median sold price peaked at $680,000 in May 2022 and is now $578,250, a drop of $101,750 or 15.0%. The City of Austin median sold price per square foot peaked at $393 and currently stands at $213, a 27.5% decline from peak.
What is the outlook for the Austin real estate market this spring?
The data this week supports a cautious but real shift in market momentum. Prices are still lower year over year across both geographies, and the majority of ZIP codes and cities remain below their 12-month peaks. But fewer homes are selling under list, more are selling over, and the City of Austin's months of inventory is actually declining year over year even as supply builds metro-wide.
Spring is historically the most active season for Central Texas real estate. If buyer demand continues to absorb new listings at the current pace, the price softness that defined 2025 may not hold through the second quarter of 2026. Sellers who have been waiting for better conditions may be approaching an inflection point. Buyers waiting for prices to fall further may find that window narrowing faster than the year-over-year numbers suggest.